POL (ex-MATIC) Price Prediction: POL/USDT Buyers Are Hanging on
Estimated Reading Time: 3 minutes
Don’t invest unless you’re prepared to lose all the money you invest. This is a high-risk investment and you are unlikely to be protected if something goes wrong. Take 2 minutes to learn more
POL (ex-MATIC) Price Prediction (January 4):
The POL (ex-MATIC) token has rebounded off a key support level formed by some technical indicators. The market has continued to move north since then, with today’s trading activity so far remaining in the green despite reduced bullish momentum.
POL/USDT Long-Term Trend: Bullish (Daily Chart)
Key Price Levels:
Resistance: $0.5500, $0.6000, $0.6500
Support: $0.5000, $0.4500, $0.4000
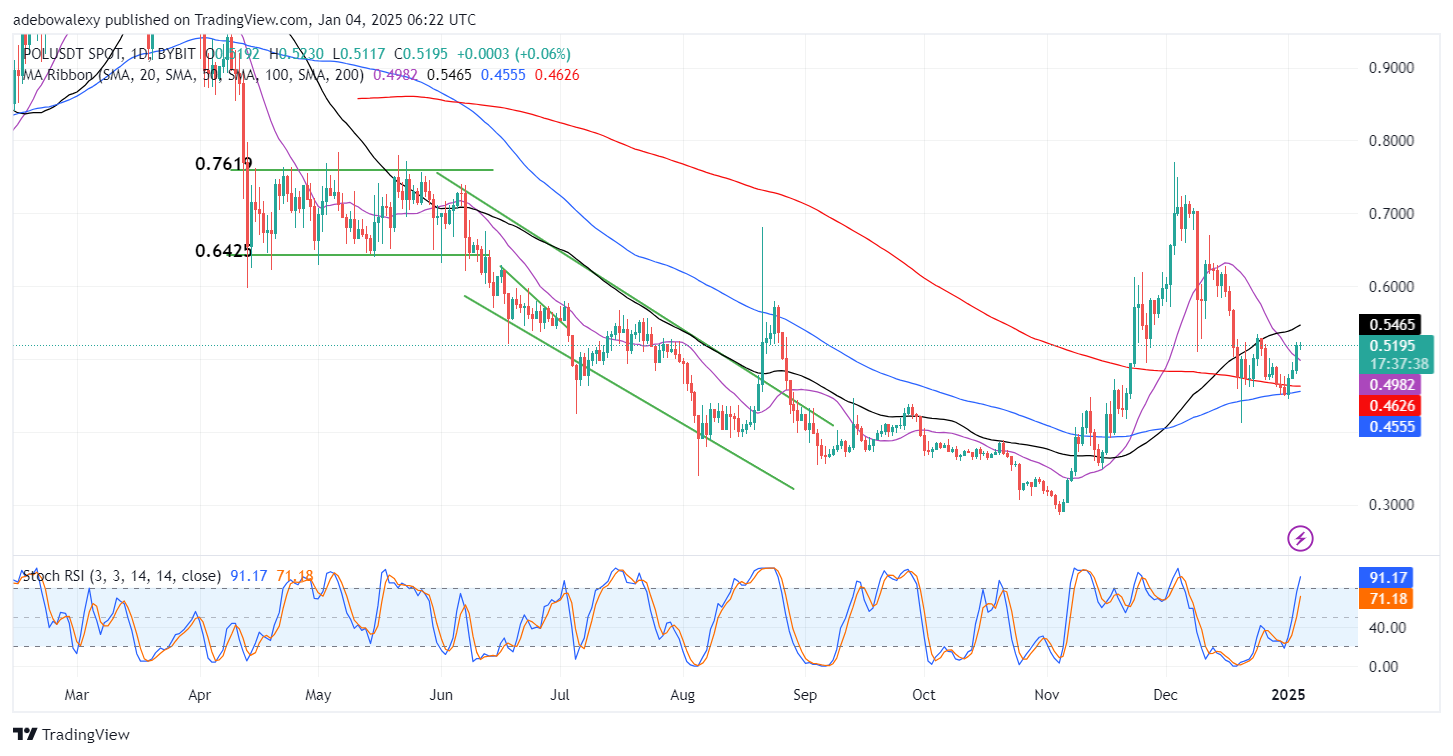
The POL (ex-MATIC) token saw a significant price increase in the previous session. However, the current session appears to be hotly contested by price forces. The last price candle on this chart is green but with a very small body. Nevertheless, it brings the market to stand above 3 out of the 4 Moving Average (MA) lines. Also, the Stochastic RSI lines have risen considerably into the overbought region with such a moderate price movement.
POL (ex-MATIC) Price Prediction: POL/USDT Bulls May Get Exhausted Soon
The POL (ex-MATIC) market has seen a moderate recovery since its price action rebounded off the 100-day MA line as support. The momentum had heightened in the previous session as the market charged through the $0.5000 resistance level.
The current session has remained in the green even though the current price candle suggests that upside forces are currently facing strong resistance. Yet, the position of price activity above most of the MA lines and the upward trajectory of the RSI indicator lines maintain the opinion that price action may continue to move slightly higher in subsequent sessions.
POL (ex-MATIC) Price Prediction: POL/USDT Consolidates but Seems to Hold Promise (4-Hour Chart)
Price action in the POL (ex-MATIC) 4-hour market can be seen consolidating sideways in what appears to be a narrow range. Although the last and the previous price candles are green. Meanwhile, the 20- and 100-day MA lines are seen crossing below price action while the RSI lines are moving sideways at approximately the 100 level of the indicator.
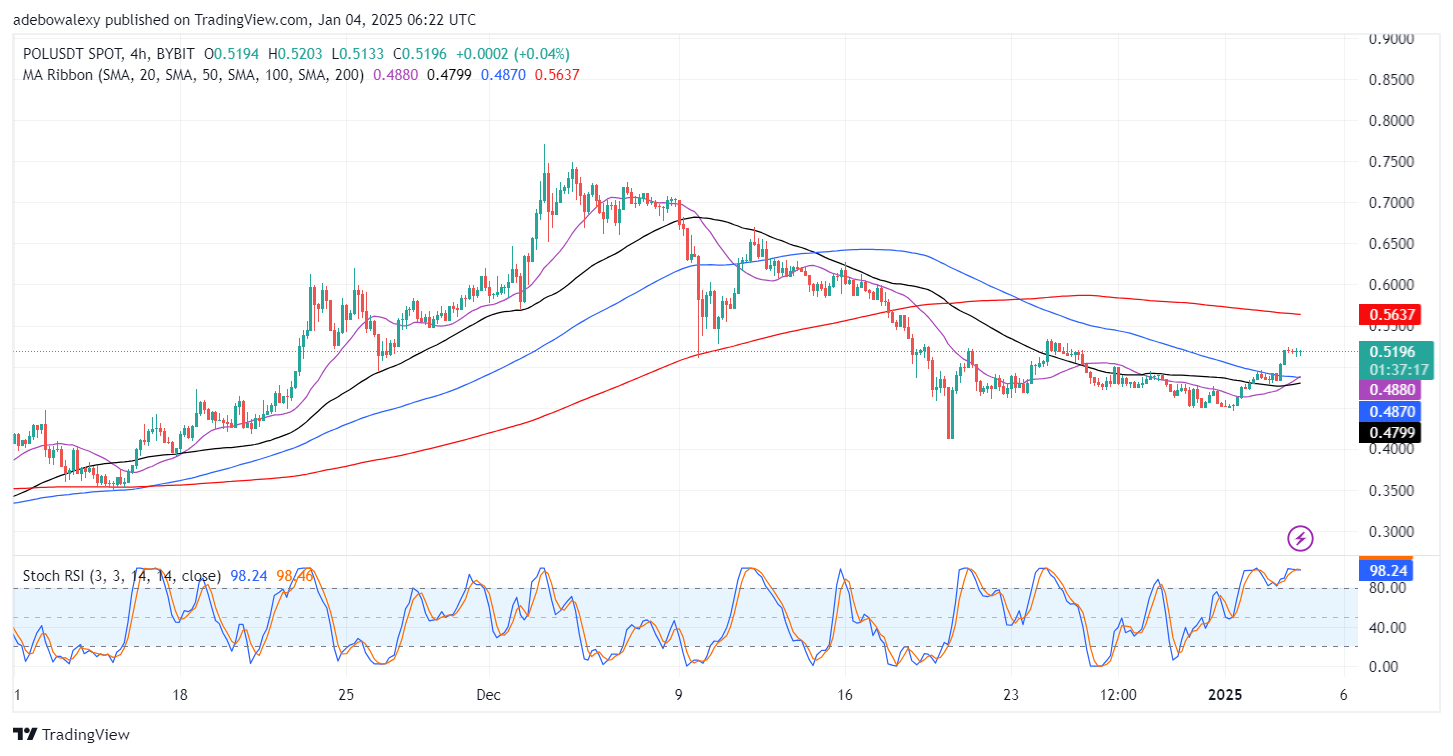
Indications arising from this market seem a bit ambiguous. The consolidative move of price action suggests that there is a strong struggle between buyers and sellers. However, the crossover of the 20- and 100-day MA lines suggests that upside forces may receive a boost since the RSI lines linger in the overbought region. At least, traders can take a fair target at the $0.5500 price mark.