Solana (SOL) Price Prediction: $180.00 Support Holds in the SOL/USDT Market
Estimated Reading Time: 3 minutes
Don’t invest unless you’re prepared to lose all the money you invest. This is a high-risk investment and you are unlikely to be protected if something goes wrong. Take 2 minutes to learn more
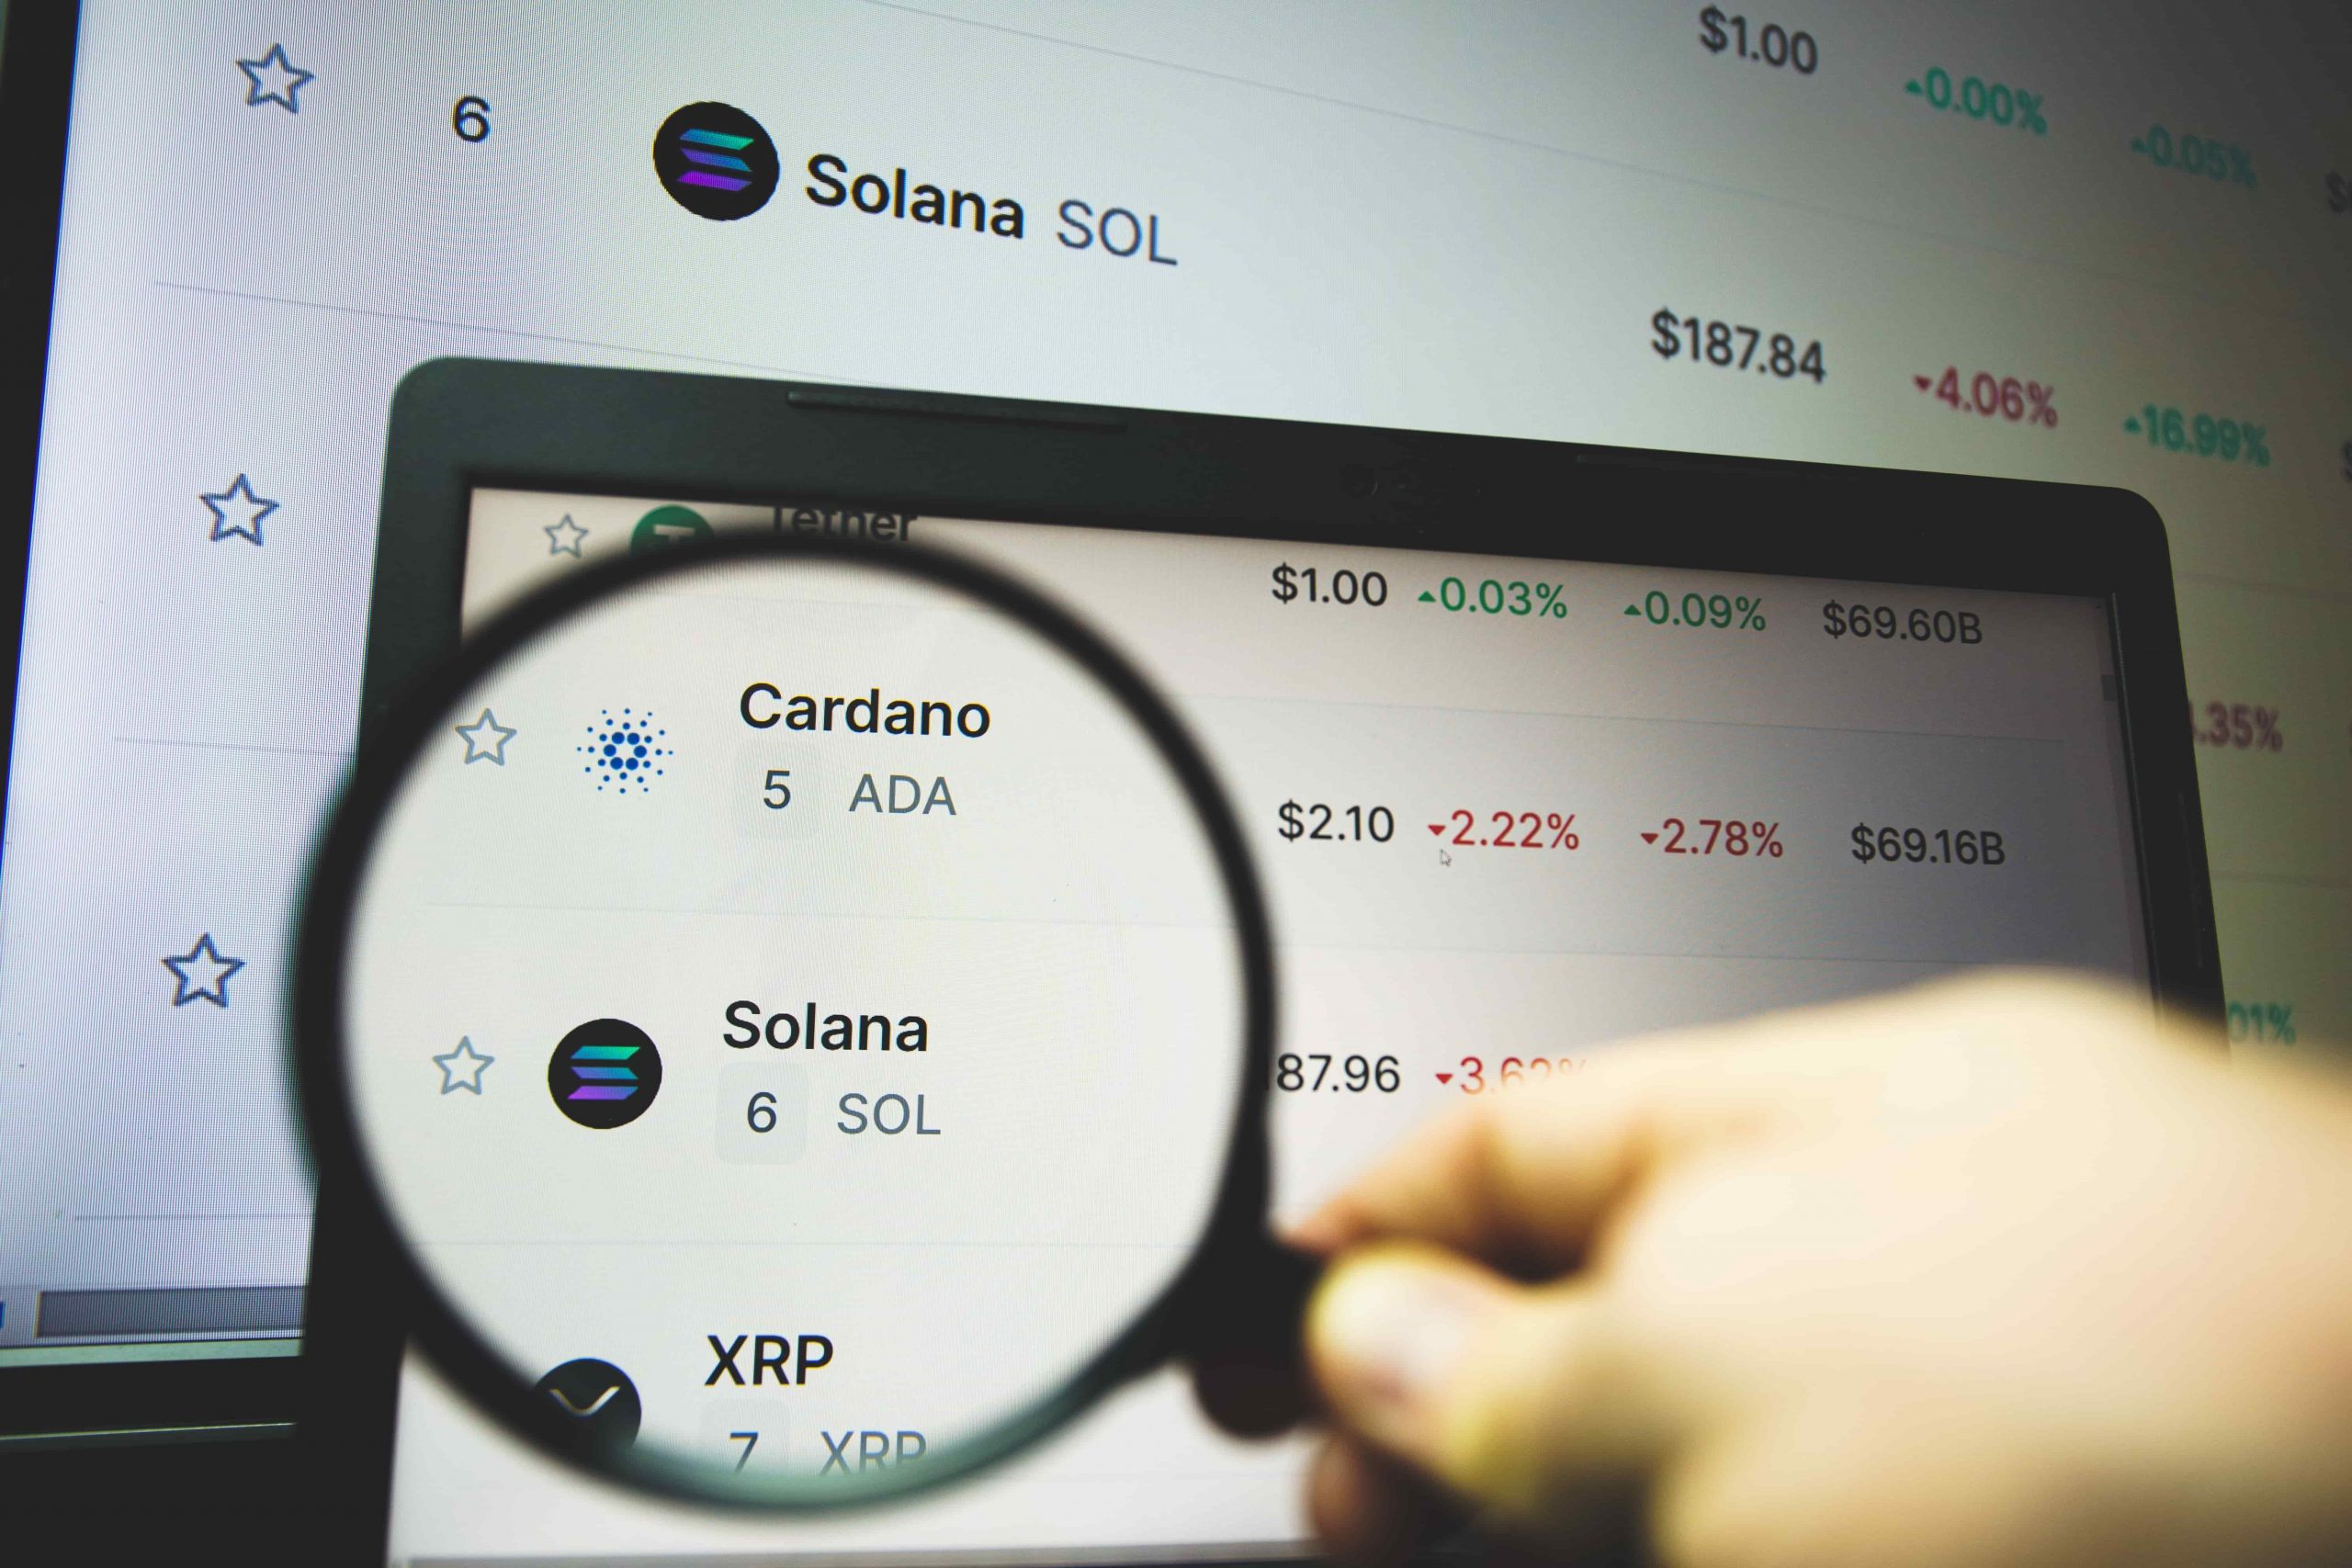
Solana (SOL) Price Prediction (January 3):
Price movement in the Solana daily market had fallen sharply toward the $185.00 support level. The market soon breached that price level and headed straight toward a more psychologically significant support level at the $180.00 mark. However, that price level seems like a strong baseline, and the market rebounded upward from there.
SOL/USDT Long-Term Trend: Bearish (Daily Chart)
Key Price Levels:
Resistance: $220.00, $240.00, $260.00
Support: $205.00, $185.00, $165.00
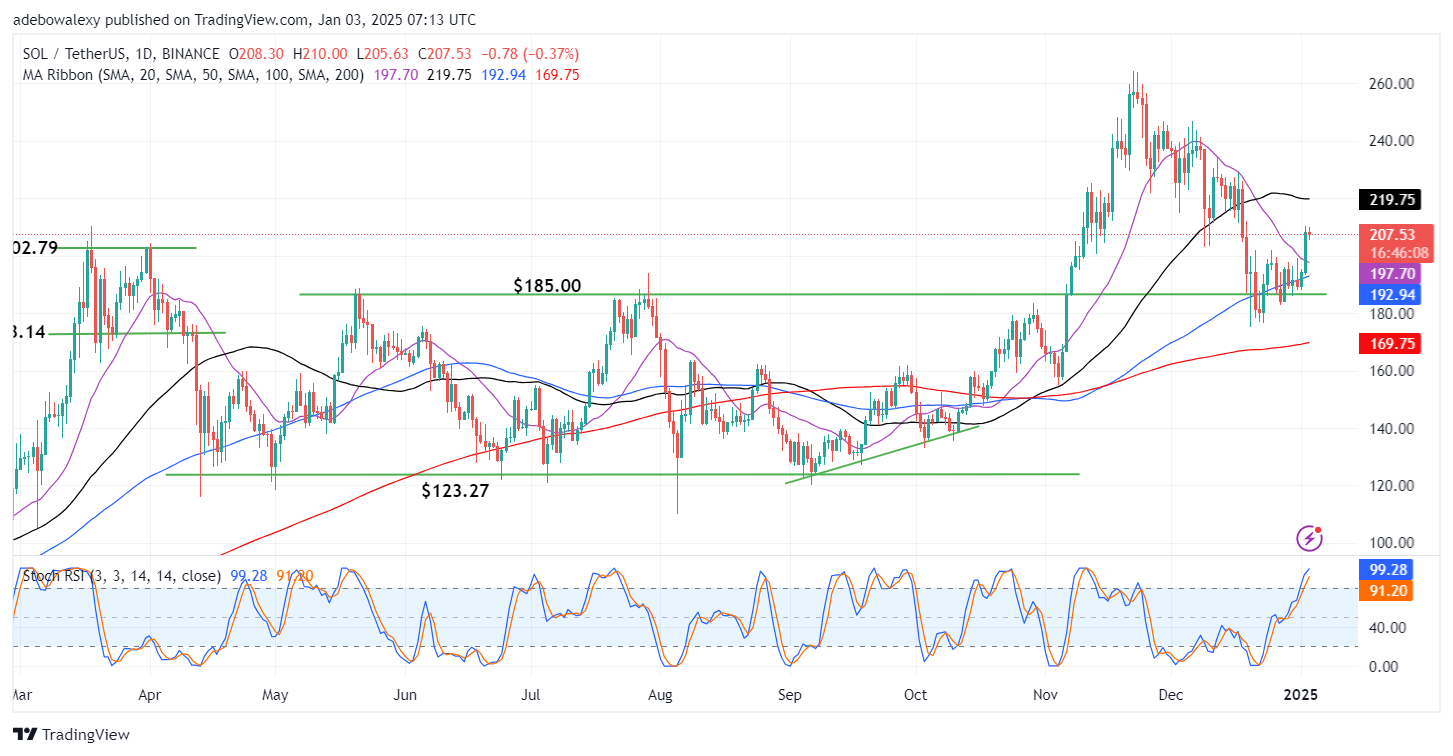
Price action in the Solana daily market saw a strong upward rebound in the previous session. However, this seems to have attracted some short-selling and has resulted in a slight downward retracement in the ongoing session. Be that as it may, price action stays above most of the Moving Average (MA) curves. Also, the 20- and 100-day MA lines are approaching each other for a potential crossover below the current price level of this token. Likewise, the Stochastic Relative Strength Index (RSI) indicator lines are still rising into the oversold region.
Solana (SOL) Price Prediction: SOL/USDT May Shake Off Bearish Deflections
The Solana daily market currently presents a minor downward retracement. Nevertheless, the overall trend seems to remain bullish. The last red price candle on the daily price chart indicates that there have been some short-selling trades in the market, perhaps as a result of price action hitting a few targets. Nevertheless, the market remains above most of the MA lines on the chart.
The trajectory of the Stochastic RSI lines is also still bullishly biased and points to the fact that the overall market’s short-term trend remains bullish. Also, these lines are in the overbought region of the indicator and thus suggest that strong resistance may be near.
Solana (SOL) Price Prediction: SOL/USDT Consolidates at $205.88 (4-Hour Chart)
As noticed on the Solana daily chart, we can see that price action, as of the time of writing, has recorded a slight downward retracement. On the 4-hour chart, it can be seen that price action seems to have been oscillating more around the $205.88 price level. Consequently, this seems to have presented a strong but short-term baseline. Nevertheless, price action stays above most of the MA lines, which lie below recent price candles.
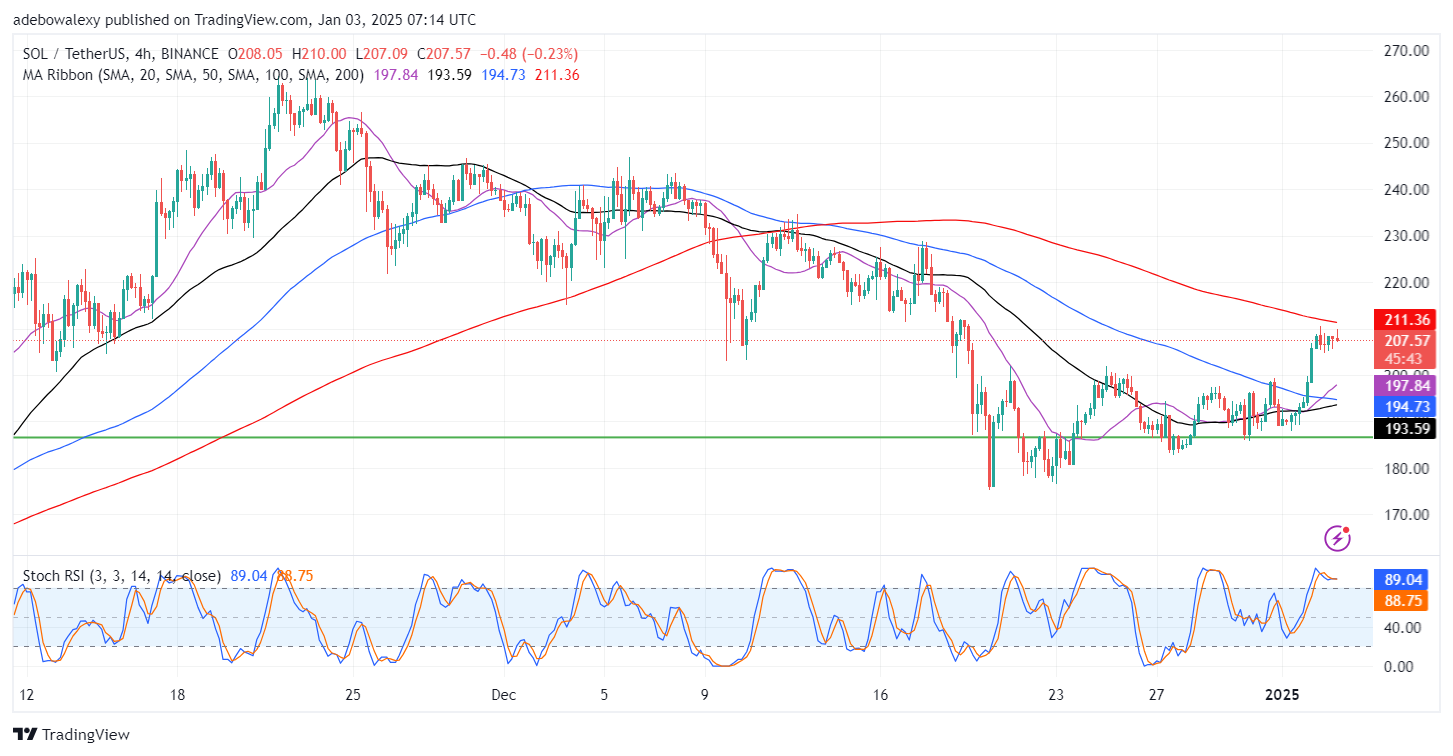
The last price candle on this chart stands off the aforementioned support level, bringing the token to trade at $207.94. In addition, the Stochastic RSI lines can be seen delivering an upside crossover above the 80 mark of the indicator, but the lines are still moving sideways. However, should price action rise past the 200-day MA line, traders may anticipate a retracement towards the $220 price level subsequently.