Bitcoin (BTC/USD) Market Hovers at $20,000
Estimated Reading Time: 3 minutes
Don’t invest unless you’re prepared to lose all the money you invest. This is a high-risk investment and you are unlikely to be protected if something goes wrong. Take 2 minutes to learn more

Free Crypto Signals Channel
Bitcoin Price Prediction – June 22
There has been a sharp decline in the BTC/USD trade worth beyond the current trading zone. Presently, the crypto market hovers around the $20,000 between the $22,500 resistance line and the $17,500 support line, keeping a negative percent of 1.59.
BTC/USD Market
Key Levels:
Resistance levels: $22,500, $25,000, $27,500
Support levels: $17,500, $15,000, $12,500
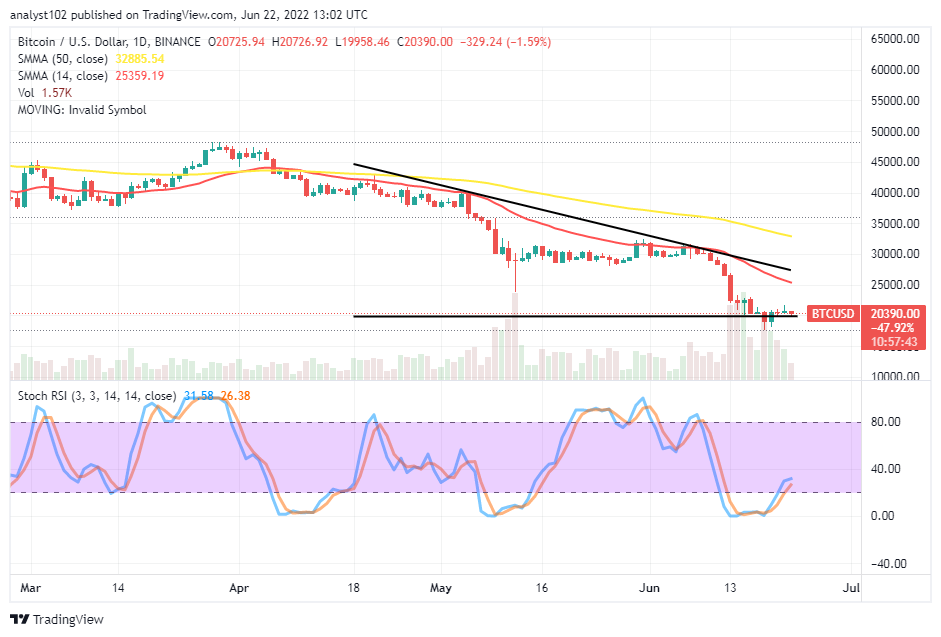
BTC/USD – Daily Chart
The BTC/USD daily chart showcases the crypto market hovers around the $20,000 trading level. The horizontal line is drawn at the value line to mark it as a critical support baseline. The 14-day SMA trend line has moved southward closely to the $25,000 resistance level underneath the trend line of the 50-day SMA. The Stochastic Oscillators have sprung northbound from the oversold region, attempting to close their lines between the 20 and 40 range points.
Will the BTC/USD trade still feature around the $20,000 for some time?
It appears a lot more buying and selling activities will still occur in the BTC/USD trade around the $20,000 psychological trading line for some time as the crypto market hovers at the value line. Long-position takers have to watch out for price reactions coming up with upswing forces to consider a buying order around the point mentioned earlier. A fearful southward push against the value line will negate any buying position order that might have opened around it.
On the downside of the technical analysis, there may be a line of sideways movements around the $20,000 trading level. A short active pull-up a bit over the value line, running back downward immediately in the process, can potentially allow bears to get an entry to let the market get pushed southward further to a lower support-trading zone. Traders needed to be wary of a rebound possible to occur in no time.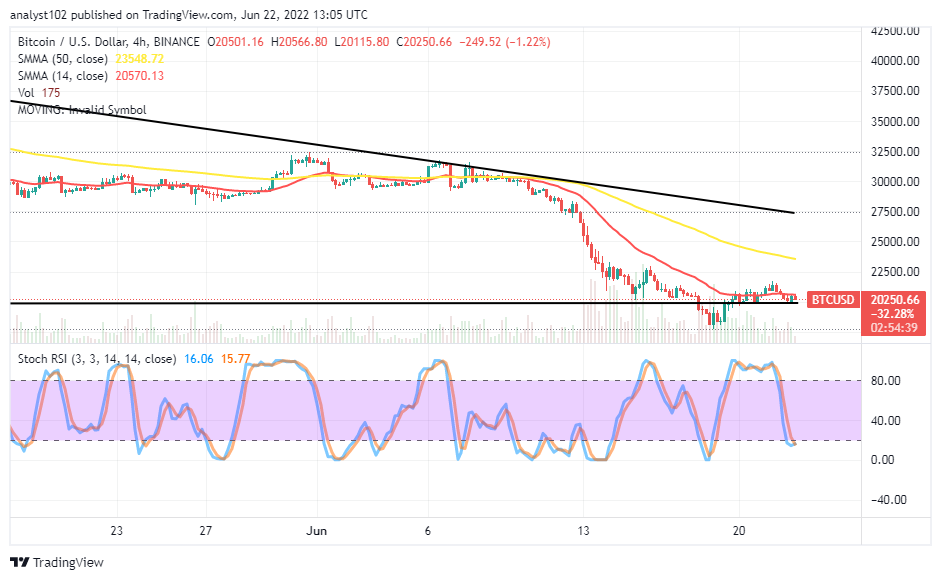
BTC/USD 4-hour Chart
The BTC/USD medium-term chart reveals the crypto market hovers at $20,000 around the trend line of the smaller SMA. It has been by the 14-day SMA trading indicator that the actual resistance value is around $20570 underneath the 50-day SMA indicator. The bearish trend line drew above them to markdown the market operation at $27,500. The Stochastic Oscillators have moved southbound to touch an area closely beneath the range of 20 in the oversold region. The trading outlook appears yet not been over from falling. Short-position takers should be cautious of position entries.
Note: Cryptosignals.org is not a financial advisor. Do your research before investing your funds in any financial asset or presented product or event. We are not responsible for your investing results.
“Lucky is up more than 50% today but still more than 430% from All Time Highs!
The opportunity to bank BIG is now!
You can purchase Lucky Block here. Buy LBlock


