LBLOCK Price Outlook: Navigating Volatility and Potential Rebound
Estimated Reading Time: 3 minutes
Don’t invest unless you’re prepared to lose all the money you invest. This is a high-risk investment and you are unlikely to be protected if something goes wrong. Take 2 minutes to learn more
Lucky Block(LBLOCK)Price Prediction- May 8
Lucky Block (LBLOCK) is currently trading at $0.00003371, with a 24-hour trading volume of $15,864. The price is down -7.03% in the last 24 hours, indicating a recent downturn in the market. Over the last week, LBLOCK’s price range has fluctuated between a low of $0.00002922 and a high of $0.00003917, showcasing its volatility. Historically, the token reached an all-time high of $0.00954 and an all-time low of $0.00001789.
These historical price points provide insight into the potential range of movement for the asset.With these figures in mind, let’s dive into the current technical indicators and analyze the potential direction of LBLOCK’s price.
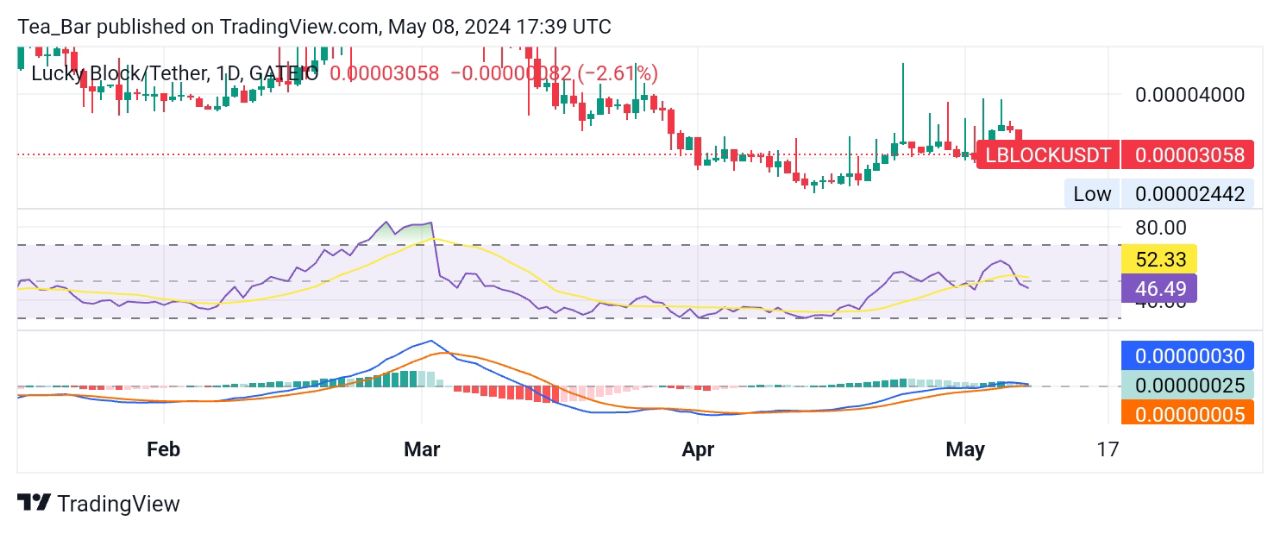
LBLOCK/USD Long-term Trend: Bearish (Daily Chart)
Key levels:
Resistance Levels: $0.00003500, $0.00003900, $0.00004000
Support Levels: $0.00003300, $0.00003000, $0.00002500
The immediate support for Lucky Block is at $0.00003300. If the price falls below this level, the next support can be found at $0.00003000. Meanwhile, the immediate resistance is seen at $0.00003500, which aligns with the 7-day high. A successful break above this level could see the price test the next resistance at $0.00003900.
The 1-day RSI is at 46.44, pointing to a neutral market condition overall. Meanwhile, the 1-day MACD is slightly bullish at 0.00000024, suggesting the potential for an upward trend in the long term if buying pressure increases.
LBLOCK/USD Medium-term Trend: Bearish (4H Chart)
The 4-hour RSI at 32.27 indicates an oversold condition, hinting at potential short-term rebound opportunities. However, the 4-hour MACD is bearish with a value of -0.00000046, suggesting ongoing selling pressure may limit the extent of any potential recovery. Traders should monitor momentum indicators for potential shifts.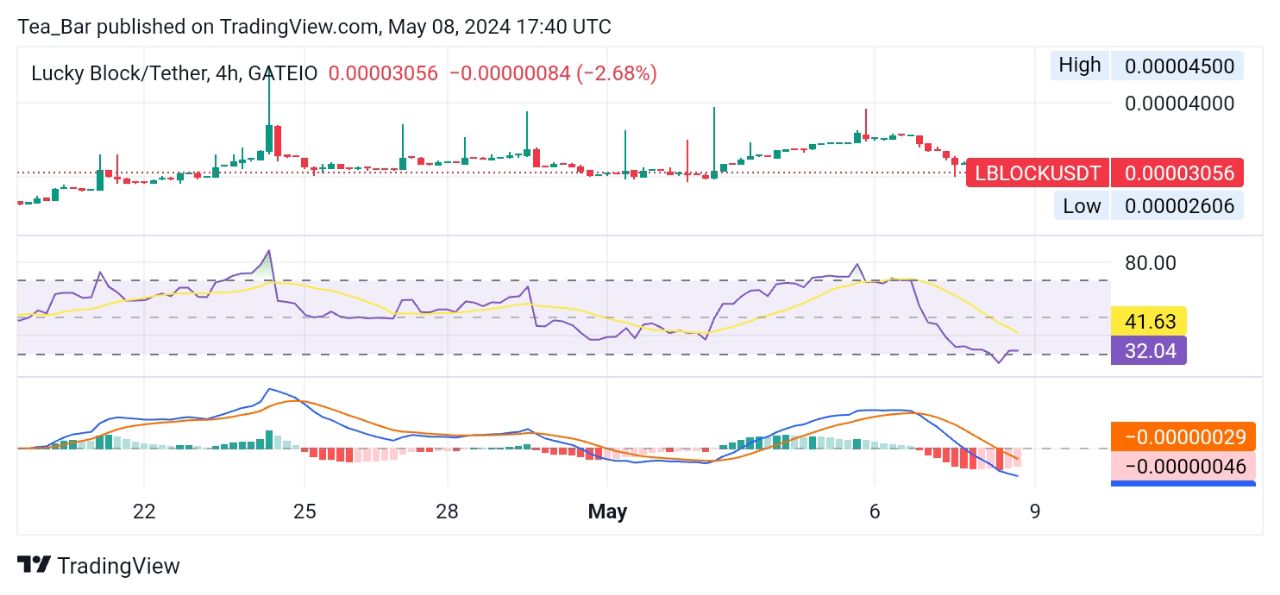
Conclusion
Lucky Block (LBLOCK) is facing short-term bearish pressure but may experience a rebound given its oversold condition on the 4-hour chart. Traders should watch for a potential recovery, particularly if the price can break above the immediate resistance at $0.00003500.
If this happens, a move towards the next resistance at $0.00003900 may be on the cards. Keeping an eye on key support and resistance levels is crucial for traders looking to capitalize on price movements.
You can purchase Lucky Block here. Buy LBLOCK.