Facing the Bears: Lucky Block (LBLOCK) Struggles Against Market Downturn
Estimated Reading Time: 3 minutes
Don’t invest unless you’re prepared to lose all the money you invest. This is a high-risk investment and you are unlikely to be protected if something goes wrong. Take 2 minutes to learn more

Lucky Block Price Prediction- April 12
At the time of writing, the Lucky Block is valued at $ 0.00002640. Its price has declined by -3.5769% in the past hour, -7.2776% over the last 24 hours, and -13.4861% throughout the past week. Lucky Block attained its peak price of $ 0.009691 on February 18, 2022, and its lowest price of $ 0.00002342 on October 21, 2023.
Following its all-time high, the lowest recorded price was $ 0.00002342 (cycle low), with the highest since then being $ 0.00009641 (cycle high). Currently, the sentiment for Lucky Block price prediction leans bearish.
LBLOCK/USD Long-term Trend: Bearish (Daily Chart)
Key levels:
Resistance Levels: $ 0.00002700, $0.00002800, $0.00002900
Support Levels: $0.00002500, $0.00002400, $0.00002300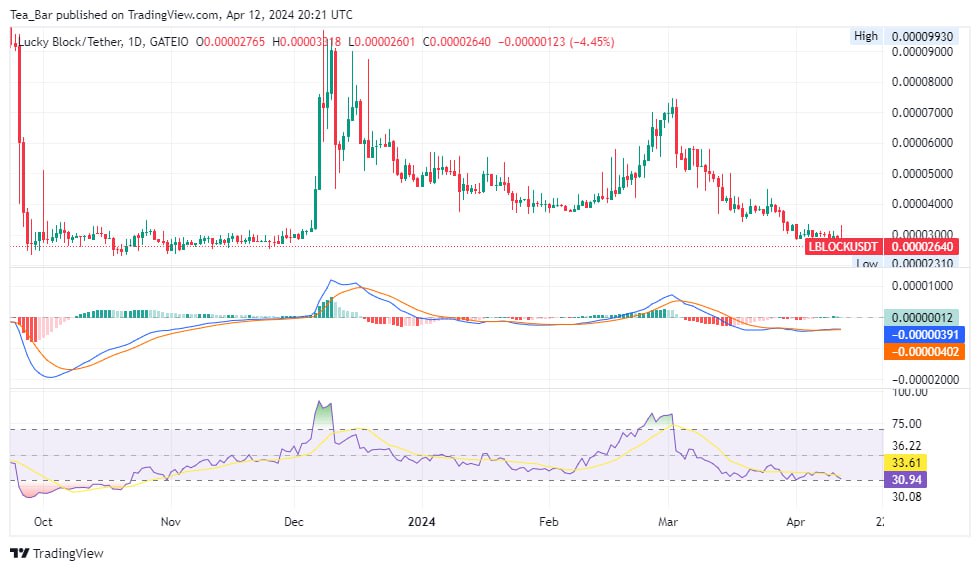
The long-term trend for LBLOCK/USD appears bearish on the daily chart, with resistance levels at $0.00002700, $0.00002800, and $0.00002900. Conversely, support levels are seen at $0.00002500 and nearby ranges.
To overcome the resistance barriers in the LBLOCK/USD pair, traders could look for significant increases in buying pressure to push the price above the resistance levels. This could be achieved through positive market sentiment, strong fundamental developments, or increased trading volume.
Additionally, strategic entry points and breakout confirmation signals can help traders capitalize on potential bullish momentum to break through these resistance levels.
Lucky Block’s Bearish Move: What to Expect
LBLOCK enthusiasts are buzzing with excitement as signs of a robust rebound begin to materialize, brushing off recent setbacks with unwavering optimism. Fueled by a resilient foundation and a passionate community, confidence in the project’s future is unwavering.
Exciting developments and strategic alliances hint at a potential surge, sparking hope for a substantial uptick.
LBLOCK/USD Medium-term Trend: Bearish (4H Chart)
LBLOCK price maintains its position near $0.00002640, as seen on the 4-hour chart. Importantly, a bearish crossover manifests on the MACD, with the blue line descending below the signal line, indicating a potential downturn. 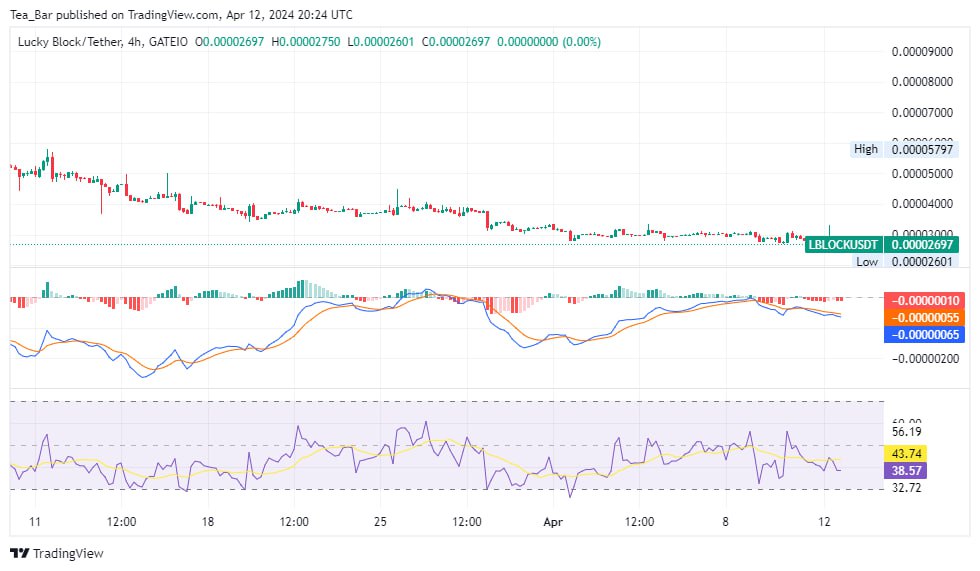
Furthermore, the downward trajectory of the RSI line accentuates the prevailing bearish sentiment. Market participants are keenly observing these indicators, poised to react to evolving market dynamics and potential trading prospects.
With anticipation running high, traders stand ready to capitalize on the resurgence of LBLOCK, poised for lucrative opportunities in the revitalized market landscape.