Polygon (MATIC/USD) Price Maintains a Decline in Lower Lows
Estimated Reading Time: 3 minutes
Don’t invest unless you’re prepared to lose all the money you invest. This is a high-risk investment and you are unlikely to be protected if something goes wrong. Take 2 minutes to learn more
Polygon Price Prediction – January 1
Polygon market’s price maintains a decline in lower lows against the trading worth of the US Dollar. Over several bargaining hours into the hours of today, the price has been between $0.759 and $0.747 value lines at an average percentage rate of 0.40 negative.
MATIC/USD Market
Key Levels
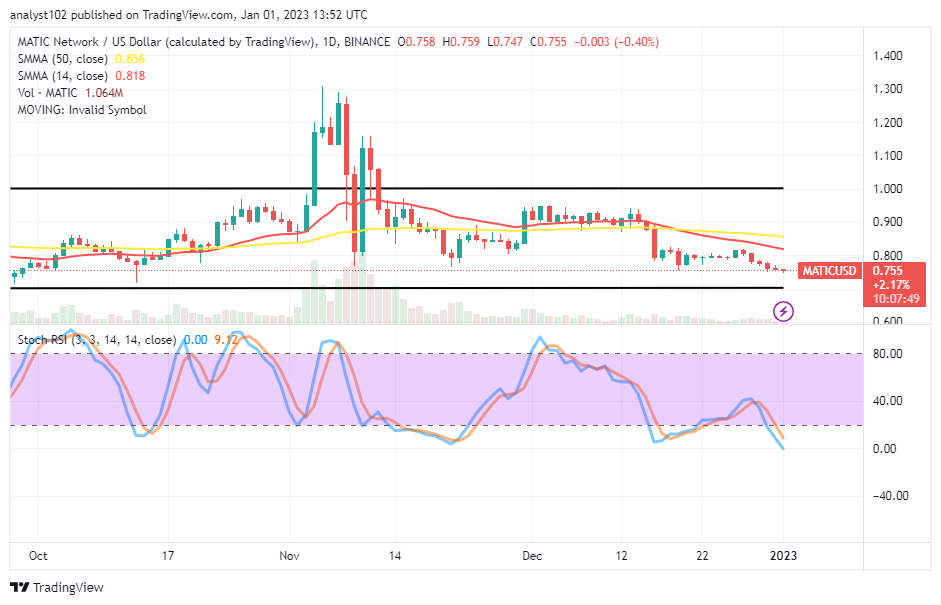
Resistance levels: $0.85, $0.90, $0.95
Support levels: $0.70, $0.65, $0.60
MATIC/USD – Daily Chart
The daily chart reveals that the MATIC/USD price maintains a decline in lower lows, approaching the support level of $0.70. As of this writing, the market features a positive response to a force inflicted by bears tightly below the value points of the SMAs. The 14-day SMA indicator is at $0.818 point beneath the $0.856 value line of the 50-day SMA indicator. The Stochastic oscillators have crossed southbound to touch 9.12 and 0.00 levels. And that implies the counter-trading crypto is still somewhat inflicting a depression upon its base crypto.
What is the MATIC/USD market’s likely lower low point, considering its current outlook?
There may still be room for the MATIC/USD market traders to push down further to the $0.70 support level as the price maintains a decline in lower lows. In the wake of that condition, tending to prolong more long-position placers will have to be cautious of exerting positions abruptly without having a rebound that can actively produce an opposing signal against getting a re-occurrent loss of momentum to the downside below the trading spot of the SMA trend lines.
On the downside of the technical analysis, as there has been a continual holding of fall-offs in a lower low style over time, sellers should be wary of any eventual emergence of a bullish candlestick at a deep lower-trading zone toward the $0.70 support level. Price holds down in the south as things stand, though, the downward momentum does not appear to be about to undergo a substantial alteration. Reduced LowsThe reading posture of the Stochastic Oscillators from the oversold region will play a role when they intend to close or clog the lines.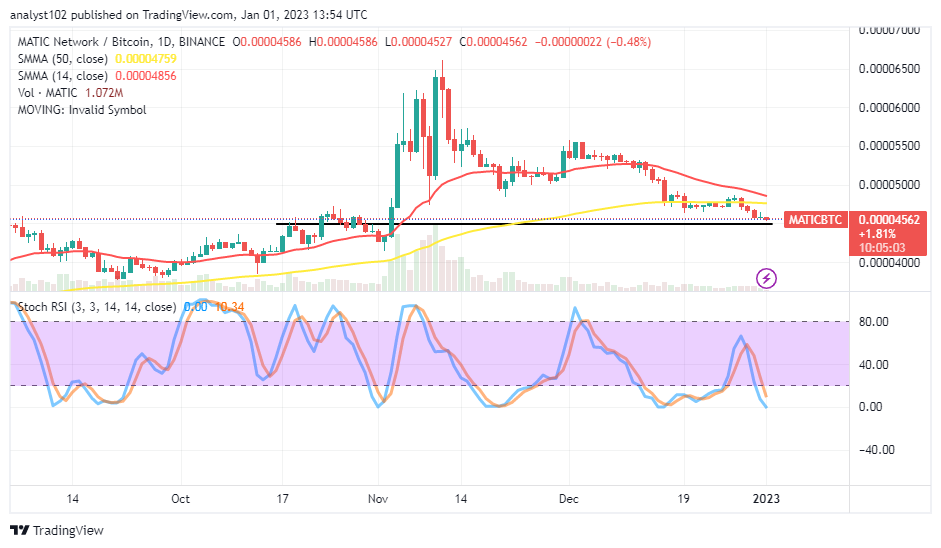
MATIC/BTC Price Analysis
Polygon, in contrast, against the trending ability of Bitcoin on the price analysis chart indicates the pairing crypto’s price maintains a decline in lower lows underneath the trend lines. The 14-day SMA indicator has closely bent southward near the 50-day SMA indicator. The Stochastic Oscillators portend traveling mode to the southbound, maintaining 10.34 and 0.00 levels. Indications still suggest the base crypto economy is on a course of debasing, pairing with the trending weight of the counter-trading crypto.
Note: Cryptosignals.org is not a financial advisor. Do your research before investing your funds in any financial asset or presented product or event. We are not responsible for your investing results.
You can purchase Lucky Block here. Buy LBLOCK