Polygon (MATIC/USD) Price Is Reversing, Approaching a Base
Estimated Reading Time: 3 minutes
Don’t invest unless you’re prepared to lose all the money you invest. This is a high-risk investment and you are unlikely to be protected if something goes wrong. Take 2 minutes to learn more
Polygon Price Prediction – March 17
A downward path has been embarked upon by bears to checkmate the activities of bulls, given that the MATIC/USD market is reversing their rises around the line of $1.30, approaching a base possibly around the lower Bollinger Band.
There are hints that the rate of decreasing capacity to the south may be about to slow down. Furthermore, the oscillators’ placement in the oversold region raises the possibility that bears aren’t seeing their strongest rallies. Before making another move back up to the upside, investors should wait to see another bullish candlestick form.
MATIC/USD Market
Key Levels:
Resistance levels: $1.10, $1.20, $1.30
Support levels: $0.90, $0. $0.85, $0.80
MATIC/USD – Daily Chart
The MATIC/USD daily chart reveals that the crypto-economic market is reversing, approaching a base.
The Bollinger Band trend lines are strategically positioned northward, marking variant systemic points between $0.90 and $1.30. The stochastic oscillators have traversed southerly to a point of zero. That implies that the pressure exerted by the counter-trading instrument should be softened on its base counterpart.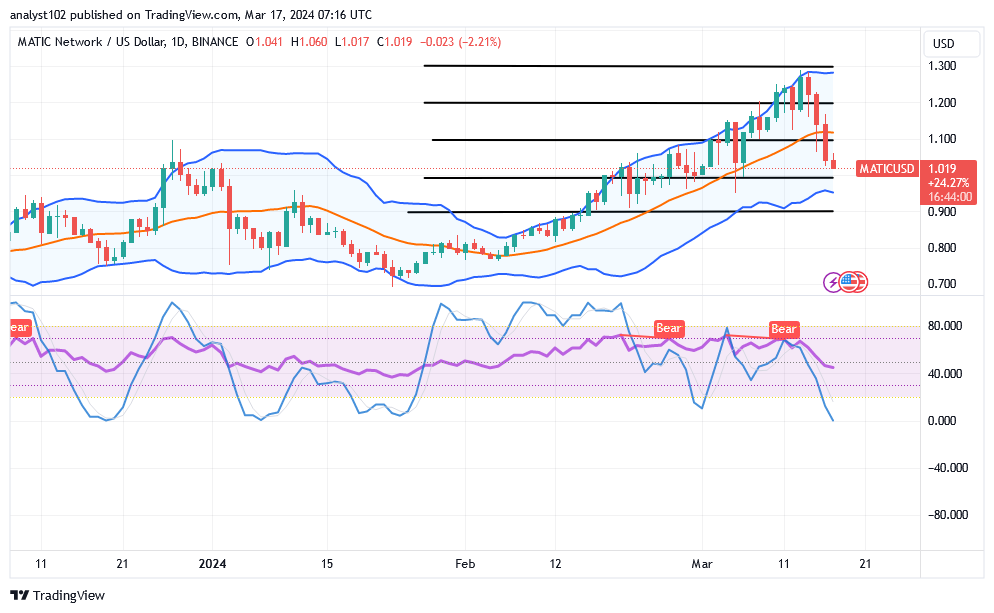
Which lower point will have a stronger underlying zone now that the sellers are in control of the MATIC/USD market?
As it has been well defined, the present falling force is tenable to face a harder underlying value built around the trend line of the lower Bollinger Band, as the MATIC/USD market is reversing and approaching a base.
When there is a strong comeback to a higher degree to offset the impact of a bearish candlestick at a lower zone, long-term investment trade plans may begin to go north again. Before a subsequent return of the rebounding force manifests itself, desiring position orders must be accumulated now in terms of thinking based on investment strategy.
If sellers in the MATIC/USD market continue to push at a high pace, more shorting pressures could see a profitable condition, as that will be momentarily past the lower Bollinger Band. The $0.90 support line seems to be the more solid baseline to prevent further lows, even though that opinion tends to play out.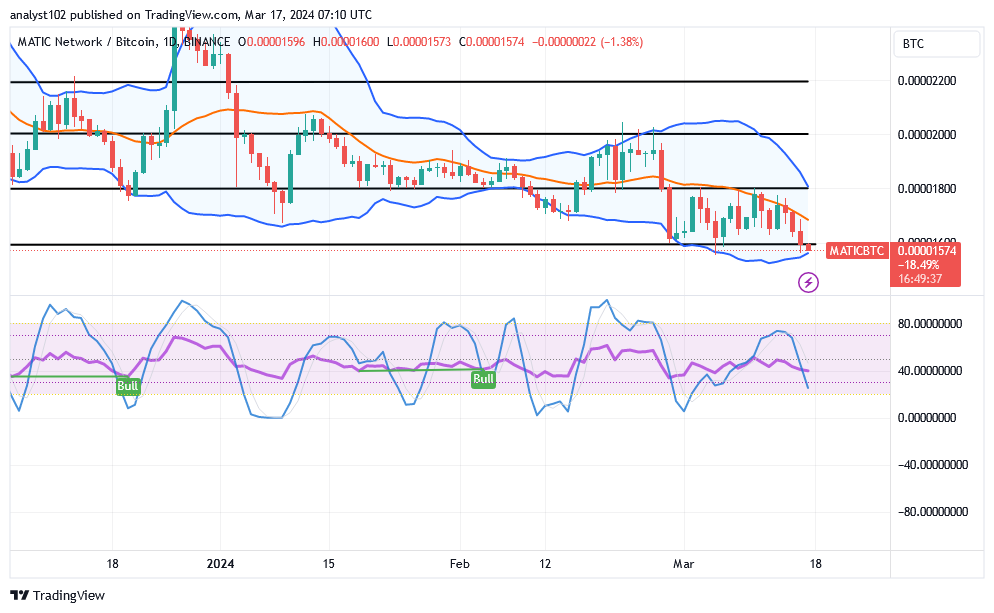
MATIC/BTC Price Analysis
In comparison, the Polygon market is reversing its valuation versus the worth of Bitcoin, approaching a base formation around the lower Bollinger Band.
The trend lines of the Bollinger Band are positioned closely to the south, indicating a tendency to reconstruct a catalyst trade zone. An optimal anticipation regarding the moment of resurging forces has been created by revisiting the lower section of the indicators. Near the number 20, the stochastic oscillators have crossed over to the south. It looks like a bullish candlestick will occur shortly, maybe in the near future, to offset the rate of decreases.
Note: Cryptosignals.org is not a financial advisor. Do your research before investing your funds in any financial asset or presented product or event. We are not responsible for your investing results.
You can purchase Lucky Block here. Buy LBLOCK