Polygon (MATIC/USD) Trade Tests $1.20, Keeping a Positive Path
Estimated Reading Time: 3 minutes
Don’t invest unless you’re prepared to lose all the money you invest. This is a high-risk investment and you are unlikely to be protected if something goes wrong. Take 2 minutes to learn more
Polygon Price Prediction – March 10
A formidable pushing course has been exhibited by bulls at the expense of weak presence of bears in the trade lines that involve Polygon with the market worth of the US currency, as it is seen that the trade tests the key barrier point of $1.20 lately, keeping a positive path.
A close lower-trending of the middle Bollinger Band appears to support $1.10, acting as a threshold area where long-position movers shouldn’t allow any potential downward reversal motion to stay longer than necessary below it. In order to quickly restore their stance strength back to the upside.
MATIC/USD Market
Key Levels:
Resistance levels: $1.30, $1.40, $1.50
Support levels: $1, $0.95, $0.90
MATIC/USD – Daily Chart
The MATIC/USD daily chart reveals that the crypto economy tests a resistance line of $1.20 against the US dollar’s valuation, keeping a positive path.
The stochastic oscillators have been observing a slight southbound-moving mode across some points to place around the spot of 40. The Bollinger Band trend lines are maintaining a pattern, indicating there is room for the price to thrive at the expense of bears not making a sudden comeback.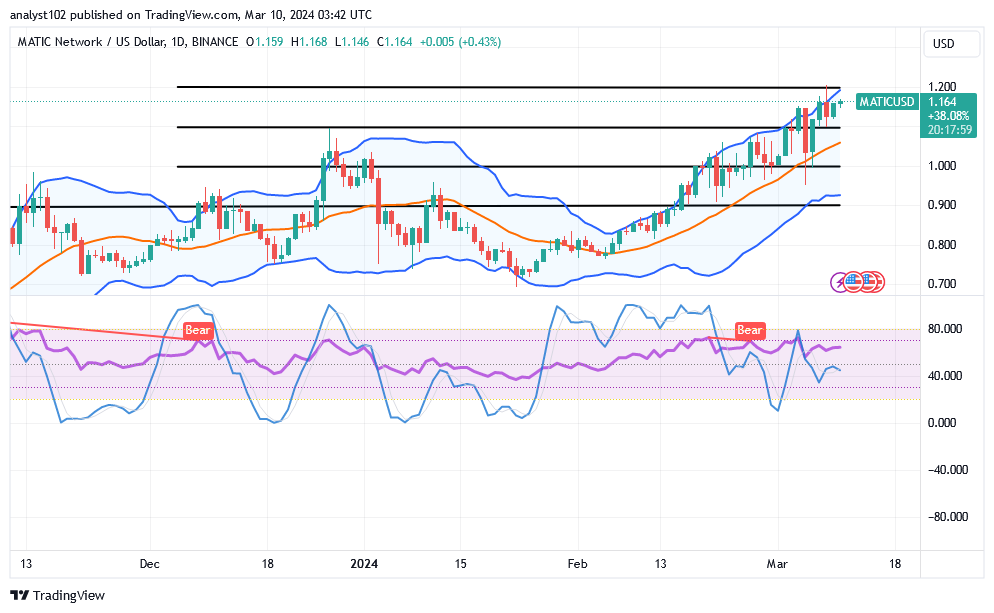
If the MATIC/USD market breaks above $1.20, what higher level will it possibly reach?
As it has been seen that $1.20 resistance is a crucial role in determining the next further moves to the upside, an aggressive breakout of the point will potentially scale through resistances up to $1.40 as the MATIC/USD price tests the point in question initially, keeping a positive path until now.
At this moment, an immediate execution of a desiring position order cannot take place until there is an active attempt to push upward in the price. Buyers should leave the market after witnessing a recessive mode of trading in order to avoid an unneeded whipsawed state that could ultimately result in a significant amount of gain.
The fact that a bearish candlestick has lately been able to span from the testing technique of the price at $1.20 suggests that a circumstance to generate a formation of rejections to additional upward velocities is not that far attainable. Sellers will need to enter the market with a defensive trade position will encourage them to post an offer if that sentiment later proves to be.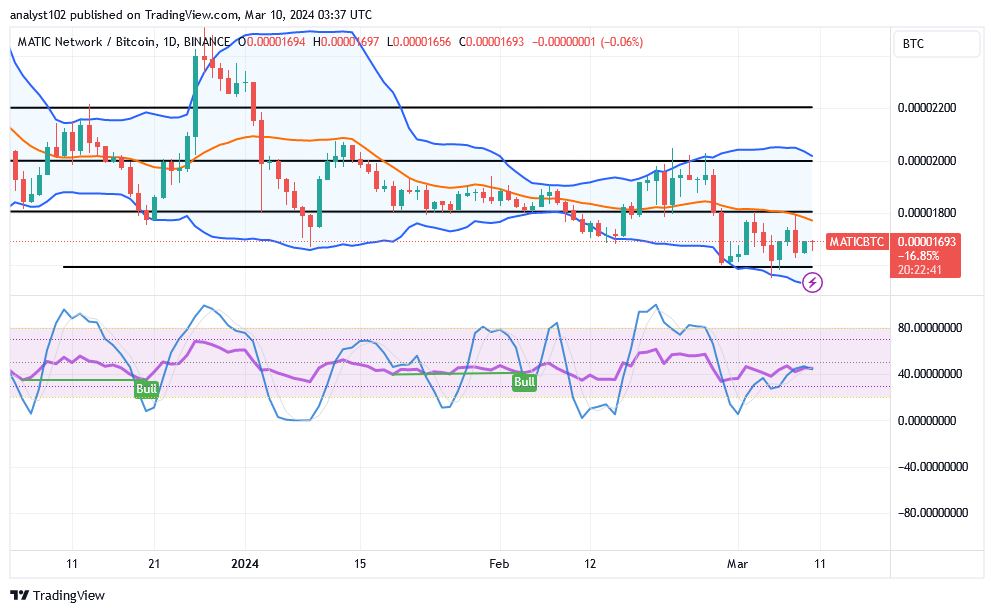
MATIC/BTC Price Analysis
In comparison, the Polygon trade has continued to bargain in the zones of lower and middle Bollinger Bands against the valuation of Bitcoin, keeping a positive index.
Over the course of a few days, the stochastic oscillators have gradually veered to the north, maintaining a touch of about 40. The Bollinger Band indicators are positioned to have significantly wider spots that indicate optimal hypothetical decision points. The base cryptocurrency is currently concentrating greater efforts on countering its counterpart.
Note: Cryptosignals.org is not a financial advisor. Do your research before investing your funds in any financial asset or presented product or event. We are not responsible for your investing results.
You can purchase Lucky Block here. Buy LBLOCK