Polygon (MATIC/USD) Market Swings High, Hitting Resistance
Estimated Reading Time: 3 minutes
Don’t invest unless you’re prepared to lose all the money you invest. This is a high-risk investment and you are unlikely to be protected if something goes wrong. Take 2 minutes to learn more
Polygon Price Prediction – March 3
It is currently observed that bulls are on the verge of getting exhausted in their ways of pushing as the MATIC/USD market swings high, hitting resistance around the value line of $1.10.
The production of price actions has been that an overbought trade condition has been reached to give birth to the need for long-position pushers to be wary of executing fresh orders. In the procedure for maintaining the present uprising forces, the bending posture of the middle Bollinger Band shows that $1 is to serve as the major support zone.
MATIC/USD Market
Key Levels:
Resistance levels: $1.20, $1.30, $1.40
Support levels: $0.90, $0.80, $0.70
MATIC/USD – Daily Chart
The MATIC/USD daily chart reveals that the crypto-economic market swings high, hitting resistance at $1.10.
The feature of candlesticks has been predominantly going along the trend path of the upper Bollinger Band. In the next few days to the present, it is likely that higher lows may play out on the crypto signal. The stochastic oscillators have systemically lower reduction values before getting repositioned at around 40 in the oversold region.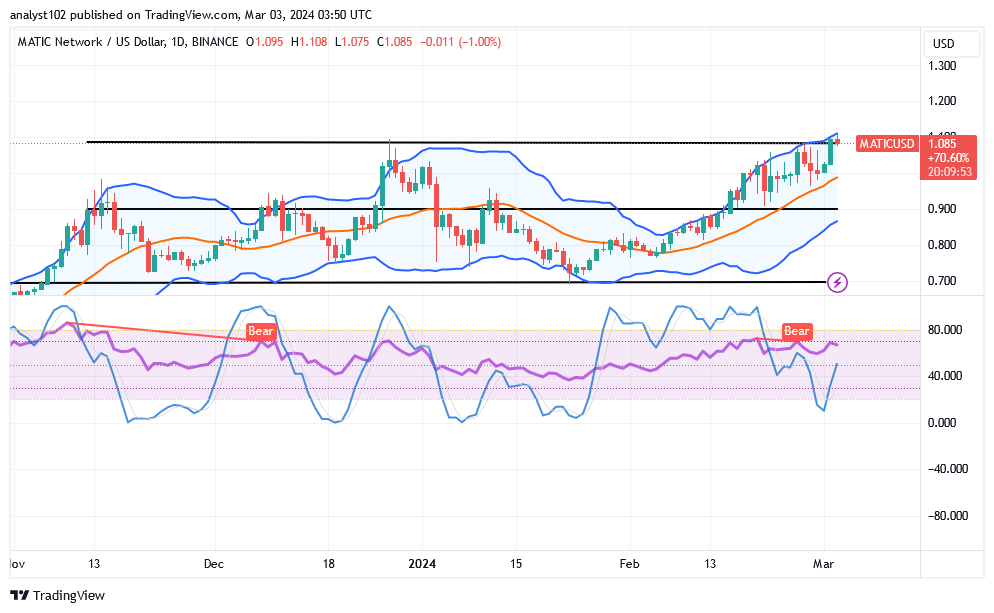
Given the current aggressive momentum of the MATIC/USD market, which trend is the price most likely to follow?
It seems that it would take the MATIC/USD market a round of pit stops at $1.10, as the crypto-economic market swings high, hitting resistances.
Buyers might find it difficult to keep up with the residually increasing pressures. It would be dangerous for further bullish rises to extend over the value line if two bearish candlesticks develop around the $1.10 mark. Price fluctuations in a very strong consolidation must stay above the $1 line.
The higher Bollinger Band trend line reading indicates that it may not be too soon for bears to reappear at the $1.10 mark. It is imperative that traders use current market movements to guide their entry decisions.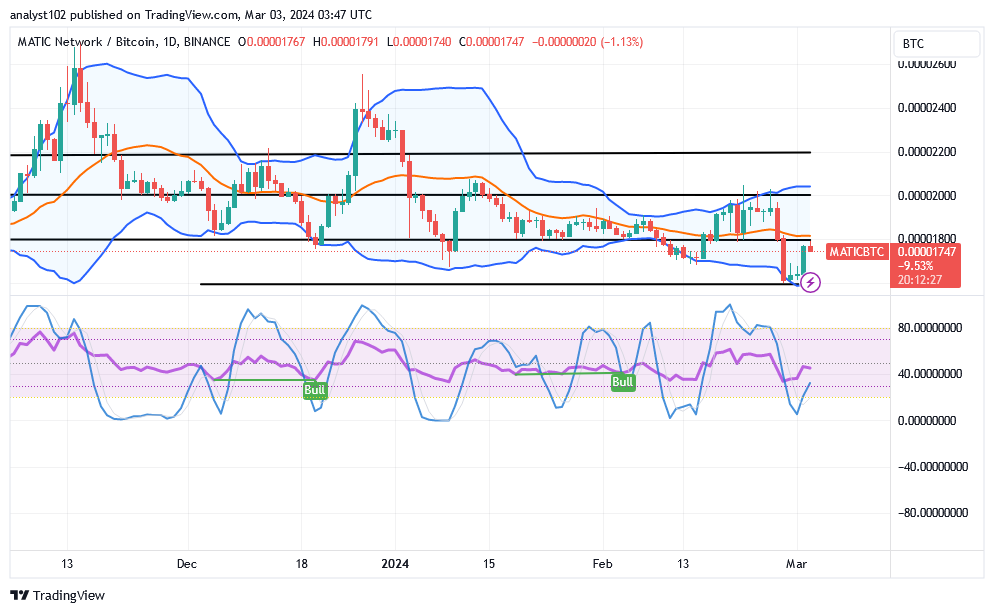
MATIC/BTC Price Analysis
In comparison, the Polygon market swings high against the worth of Bitcoin, hitting resistance at the middle Bollinger Band.
While preserving lower zones, the Bollinger Band trend lines are significantly widened to encompass vast range-bound areas. From the oversold area, the stochastic oscillators are attempting to go northward. It appears that Polygon is preparing a foundation to challenge Bitcoin.
Note: Cryptosignals.org is not a financial advisor. Do your research before investing your funds in any financial asset or presented product or event. We are not responsible for your investing results.
You can purchase Lucky Block here. Buy LBLOCK