Polkadot (DOT) Resumes Uptrend, Breaks Resistance at Level $26
Estimated Reading Time: 2 minutes
Don’t invest unless you’re prepared to lose all the money you invest. This is a high-risk investment and you are unlikely to be protected if something goes wrong. Take 2 minutes to learn more
Polkadot (DOT) Long-Term Analysis: Bullish
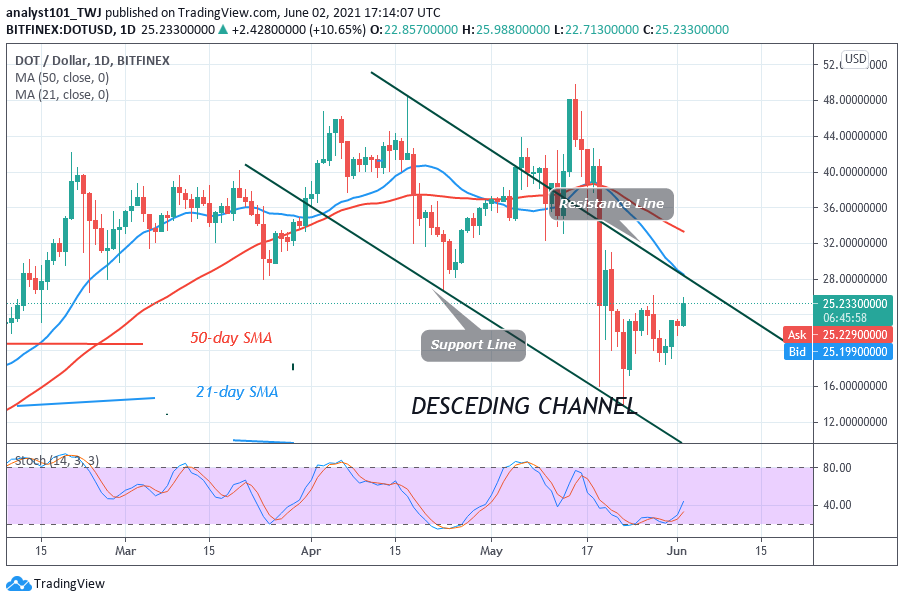
Polkadot (DOT) is making impressive moves after falling to the low of $16. Buyers have been pushing the coin on the upside. The market has reached a high of $25.76. The altcoin will regain bullish momentum if buyers push the coin above $40 high. Presently, Polkadot is facing resistance at the high of $26. On May 28, the bulls could not break the resistance at $26. The bears pushed DOT price to the low of $20 as price resumed upward
Polkadot (DOT) Indicator Analysis
DOT price has risen and approached the resistance of the descending channel. If price breaks and closes above the resistance line, the uptrend will resume. The crypto is above the 25% range of the daily stochastic, It indicates that the market is in a bullish momentum. The 21-day and 50-day SMAs are sloping horizontally.

Technical indicators:
Major Resistance Levels – $48, $52, $56
Major Support Levels – $32, $28, $24
What Is the Next Direction for Polkadot (DOT)?
Polkadot has resumed an upward move. The crypto price has broken the resistance at $26.00. However, the bullish momentum has not been sustained above it. On June 1 uptrend, a retraced candle body tested the 61.8% Fibonacci retracement level. This indicates that DOT price will rise to level 1.618 Fibonacci extension or level $26.02.

Note: new.cryptosignals.org is not a financial advisor. Do your research before investing your funds in any financial asset or presented product or event. We are not responsible for your investing results