Bitcoin (BTC/USD) Price Retraces After Reaching $25,000
Estimated Reading Time: 3 minutes
Don’t invest unless you’re prepared to lose all the money you invest. This is a high-risk investment and you are unlikely to be protected if something goes wrong. Take 2 minutes to learn more
Bitcoin Price Prediction – February 23
A long-holding of position valuations in the bid of increment has surfaced in the BTC/USD market activities, leading the crypto-economic price to retrace after reaching the $25,000 resistance line recently. The percentage rate of trading has been around 2.27 negatives as the high and low trading zones are between $24,495.38 and $23,874.41 value lines. It appears that a necessary correction of price movements will take place right now.
BTC/USD Market
Key Levels:
Resistance levels: $25,000, $26,000, $27,000
Support levels: $21,000, $20,000, $19,000
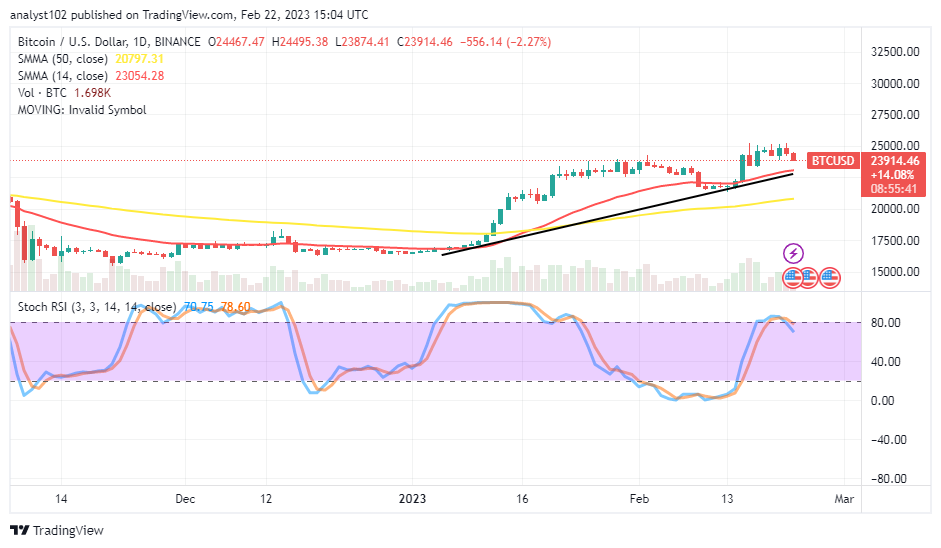
BTC/USD – Daily Chart
The BTC/USD daily chart reveals the crypto-economic price retraces after reaching the $25,000 psychological resistance level during the recent bargaining operations. The 14-day SMA indicator is at $2,3054.28 point over the $20,797.31 value line of the 50-day SMA indicator. The Stochastic Oscillators have crossed southbound from an overbought region near the 80 lines to 78.60 and 70.75 levels. That suggests the base trading instrument is on the path to losing momentum against the US Dollar.
Have the BTC/USD market buyers exhausted their reserves after reaching the $25,000 resistance level?
It has been observed and confirmed that the BTC/USD market buyers need to be a respite of their pushes around the critical trading resistance of $25,000 as the crypto economy retraces after reaching the value line. The current technical trading strategy foreshadows a more difficult barrier-trading moment that awaits a buying spree aiming to extend through the resistances around or beyond the previously mentioned point. So, therefore, it would be ideally inclined to suspend longing order positions for a while.
On the bearish side of the BTC/USD technical analysis report, an immediate shorting position order should have been placed in response to the formation of variant trading candlesticks carrying rejection signals near the $25,000 resistance level. In the meantime, the forces backing the fall-off trading move are still in place and could decimate if the trend reverses against today’s starting trade point of $24,467.47.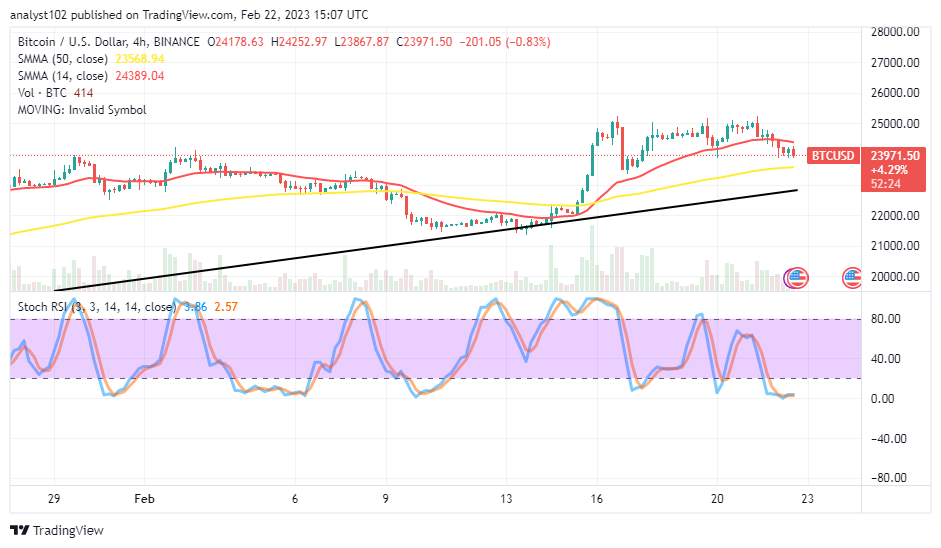
BTC/USD 4-hour Chart
The BTC/USD medium-term chart reveals the crypto-economic price retraces after reaching the $25,000 resistance level. A reversal of the correction movent against the value of the 14-day SMA indicator at $24,389.04 above the value line of the 50-day SMA indicator at $23,568.94 will cause sellers who took positions around the first mentioned line to lose some points. The Stochastic Oscillators are in the oversold region, seemingly attempting to consolidate around 3.86 and 2.57 levels.
Note: Cryptosignals.org is not a financial advisor. Do your research before investing your funds in any financial asset or presented product or event. We are not responsible for your investing results.
You can purchase Lucky Block here. Buy LBLOCK