Bitcoin (BTC/USD) Market Rallies Northward From $22,000
Estimated Reading Time: 3 minutes
Don’t invest unless you’re prepared to lose all the money you invest. This is a high-risk investment and you are unlikely to be protected if something goes wrong. Take 2 minutes to learn more
Bitcoin Price Prediction – February 15
The last couple of days’ sessions witnessed a correction in the BTC/USD trade operations as the situation has changed direction, letting the crypto market rally northward from around the $22,000 trading zone. Price is at 2.40 percent with a positive trading figure of $22,736.99 between the high and low-value points of $22,901.24 and $22,058.48 as of the writing of this analytics record.
BTC/USD Market
Key Levels:
Resistance levels: $25,000, $26,000, $27,000
Support levels: $20,000, $19,000, $18,000
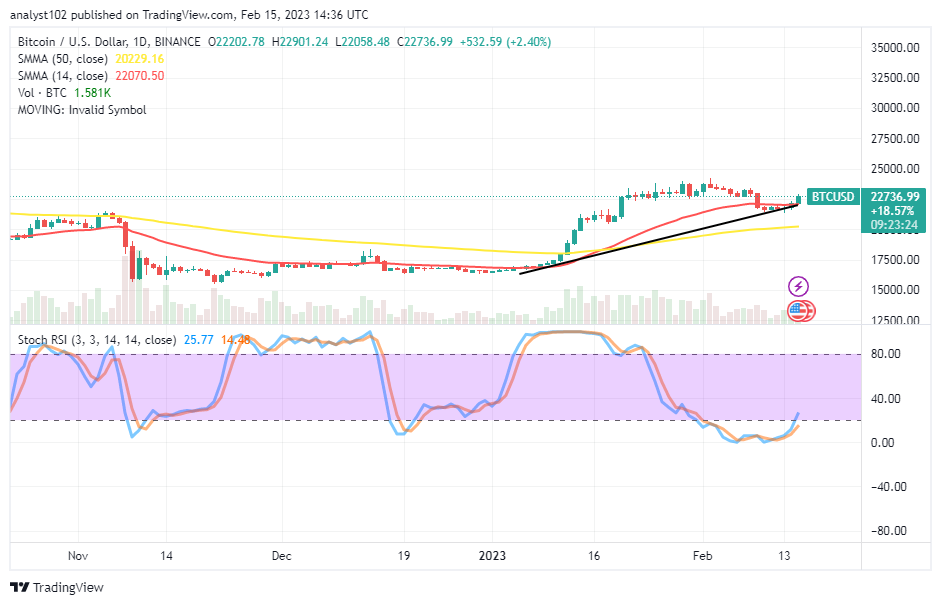
BTC/USD – Daily Chart
The BTC/USD daily chart showcases the crypto-economic market rallies northward from around the $22,000 lower-trading line, closely underneath the value point of the smaller SMA. The 14-day SMA trading indicator is at $22,070.50 over the $20,229.16 value line of the 50-day SMA indicator. The Stochastic Oscillators have been able to swerve in their direction northbound, having been able to find a stance near the zero level. That suggests some degrees of buying gravity tend to predominate in subsequent bargaining cycles.
What should be the critical point in the current rallying BTC/USD market operations?
The crucial or critical trading zone against the current BTC/USD trade operations is around the 14-day SMA indicator as the crypto market rallies northward from around the $22,000 level. Long-position placers have to catch up with the pace of buying force surfacing in the current bullish trading candlestick. A reversal of the trend in motion would give room to significant drops that can potentially revisit a low around the $20,000 psychological support level.
On the downward-moving side of the BTC/USD market technical, sellers should put their coming back on hold until the condition of an overbought region comes to be via the reading of the Stochastic Oscillators. Shorting of position orders can be kept pending around resistances of $25,000. If the price pushes fearfully against the value line will let sustainable ups be.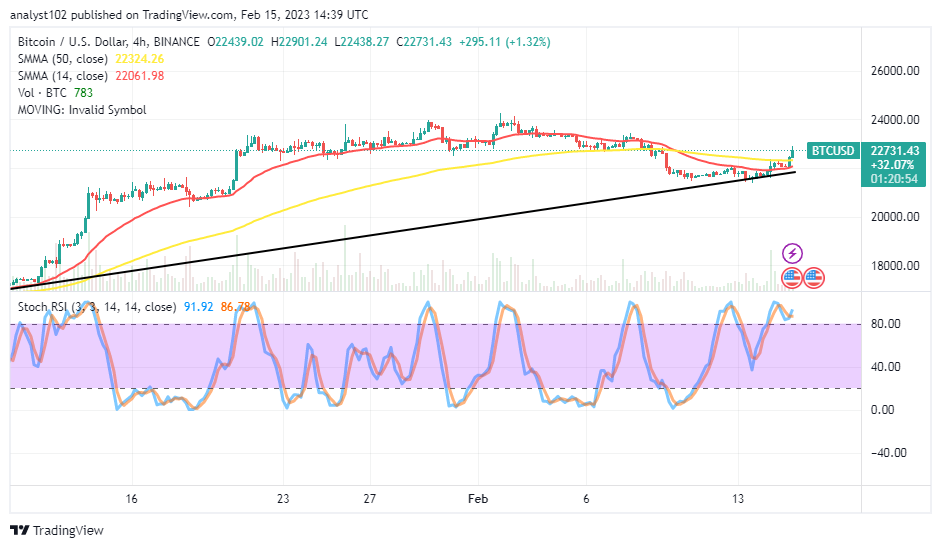
BTC/USD 4-hour Chart
The medium-term chart of the BTC/USD showcases the crypto-economic market rallies northward from around the $22,000 level. The 14-day SMA indicator is at $22,061.98 and is below the 50-day SMA indicator at $22,324.26. The Stochastic Oscillators are overbought and attempting to move northbound at 86.78 and 91.92. It appears that some uprising pressures are ongoing. Traders will have to be wary of any active attempted-reversal signal to avoid unnecessary whipsawed trading sessions.
Note: Cryptosignals.org is not a financial advisor. Do your research before investing your funds in any financial asset or presented product or event. We are not responsible for your investing results.
You can purchase Lucky Block here. Buy LBLOCK