$SPONGE (SPONGE/USD) Bullish Momentum Resurges; Bulls Rally at $0.000061
Estimated Reading Time: 2 minutes
Don’t invest unless you’re prepared to lose all the money you invest. This is a high-risk investment and you are unlikely to be protected if something goes wrong. Take 2 minutes to learn more

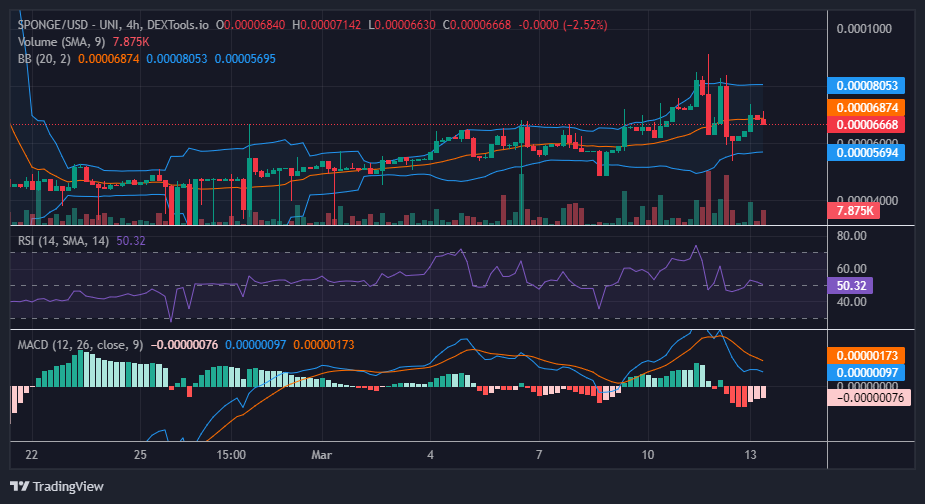
The SPONGE/USD bull market has demonstrated notable advancement; nonetheless, as the market nears the $0.00008 price level, volatility has intensified. This surge in volatility has bolstered bearish resistance at the critical $0.00008 price threshold, leading to pronounced price swings. However, on March 12th, bulls marginally exceeded the $0.00006 price mark, revitalizing bullish sentiment and reigniting momentum towards the $0.00008 price level.
Key Market Dynamics:
- Resistance Levels: $0.0010, $0.0011, and $0.0012.
- Support Levels: $0.000035, $0.000030, and $0.000025.
In-Depth Technical Analysis for $SPONGE (SPONGE/USD)
Upon examining SPONGE/USD from the chart, it becomes evident that the volume of trade indicator has experienced a notable decrease. Additionally, price action appears to be stabilizing around the midpoint, indicative of an equilibrium level. These crypto signals suggest that the market may briefly consolidate at the current price level before a nuanced bullish momentum reasserts itself. The Moving Average Convergence and Divergence (MACD) indicator indicates weakening bearish momentum, despite the latest candlestick, an inverted hammer, signaling bearish sentiment. Nevertheless, the MACD’s negative histograms remain subdued, suggesting ongoing bullish activity striving to regain dominance in the market.
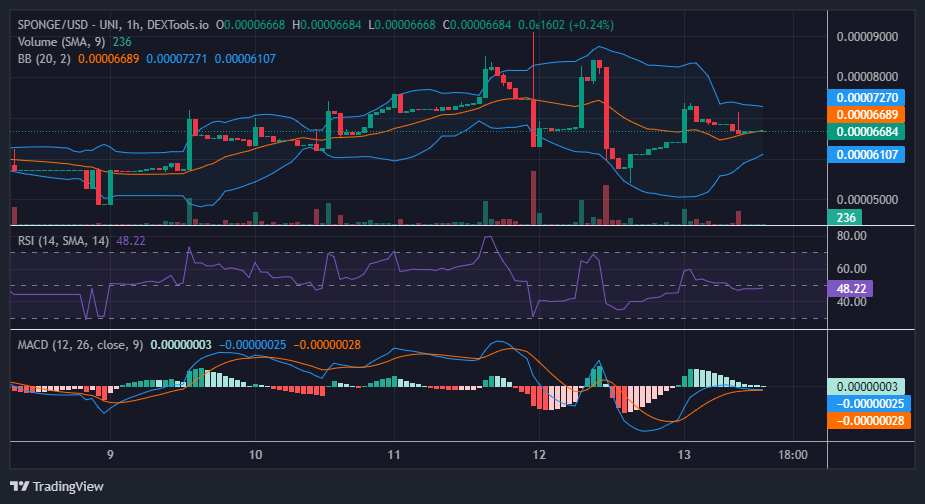
Insights from the 1-Hour Perspective
Analyzing the market from a 1-hour perspective reveals several promising indicators for bullish traders. Notably, the Bollinger Bands indicator suggests an equilibrium in the market. Furthermore, the formation of higher lows, coupled with price action flattening out and forming a doji after a notable bearish movement, is particularly noteworthy. The presence of the doji around the $0.000067 price level indicates a potential emergence of bullish pressure, possibly leading to the establishment of another higher support level.
Buy SPONGE/USD!
🧽 It be like that with $SPONGE sometimes…🧽🚀🌊#SpongeV2 #Crypto #Bullish #100x pic.twitter.com/5c1oH5rovY
— $SPONGE (@spongeoneth) March 13, 2024
Invest in the hottest and best meme coin. Buy Sponge ($SPONGE) today!