Chainlink’s Advance Halts as It Confronts the Resistance at $17
Estimated Reading Time: 2 minutes
Don’t invest unless you’re prepared to lose all the money you invest. This is a high-risk investment and you are unlikely to be protected if something goes wrong. Take 2 minutes to learn more

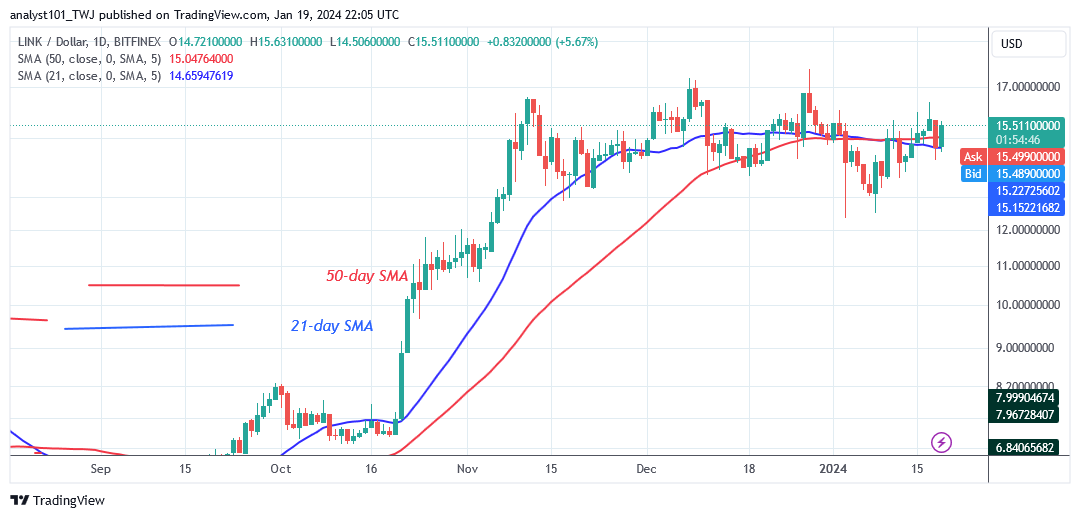
Chainlink (LINK) Long-Term Analysis: Ranging
Chainlink’s (LINK) sideways trend continues as it confronts the overhead resistance at $17. Buyers have failed to maintain the price above the $17 high after the uptrend ended on November 11, 2023. On the positive side, Chainlink is trading in an overbought market. Every time the cryptocurrency retests the resistance level above, it will fall below the moving average lines.
Today, LINK//USD is advancing to retest the barrier level of $17. The altcoin is now worth $15.51 at the time of writing. The sideways movement will continue as long as the price bars remain above the moving average lines.
Technical indicators:
Major Resistance Levels – $8.00, $10.00, $12.00
Major Support Levels – $6.00, $4.00, $2.00
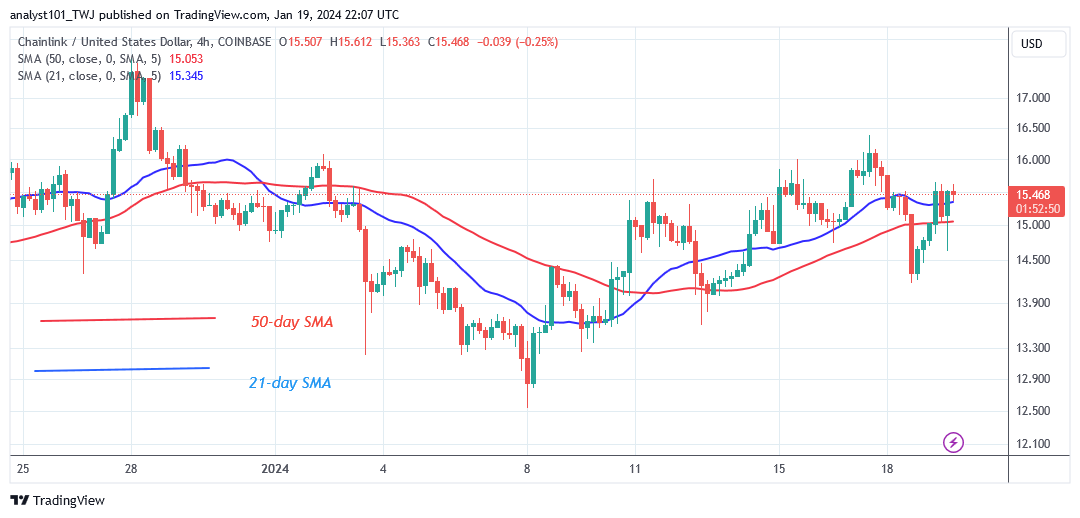
Chainlink (LINK) Indicator Analysis
The LINK price is trading in a bullish trend zone, with price bars above the moving average lines. This suggests that the sideways trend will continue in the bullish trend zone. The moving average lines on both charts are horizontal, indicating a sideways trend.
What Is the Next Direction for Chainlink (LINK)?
Currently, Chainlink is trading above the moving average lines as it confronts the overhead resistance at $17. This enables buyers to push the coin to retest the overhead resistance at $17. In other words, the coin’s price ranges between $13 and $17. When the range-bound levels are breached, the Chainlink will trend.
You can purchase crypto coins here. Buy LBLOCK
Note: Cryptosignals.org is not a financial advisor. Do your research before investing your funds in any financial asset or presented product or event. We are not responsible for your investing result