Litecoin (LTC/USD) Market Descends, Holding for a Short Time
Estimated Reading Time: 3 minutes
Don’t invest unless you’re prepared to lose all the money you invest. This is a high-risk investment and you are unlikely to be protected if something goes wrong. Take 2 minutes to learn more
Litecoin Price Prediction – August 1
A variant trade pattern negating the possibility of seeing the LTC/USD market pushing upward partially comes to play out as the crypto-economic price descends and could hold for a short time.
The trend line to the upside appears to be maintained as the crypto economies are currently on the verge of nudging into bullish trading actions, according to some analysts, which suggests that declining moves tend to be fleeting. The Bears are on top of the game as they are pressing forces at an average negative percentage rate of 1.97 to trade around $90.468767.
LTC/USD Market
Key Levels:
Resistance levels: $100, $110, $120
Support levels: $80, $75, $70
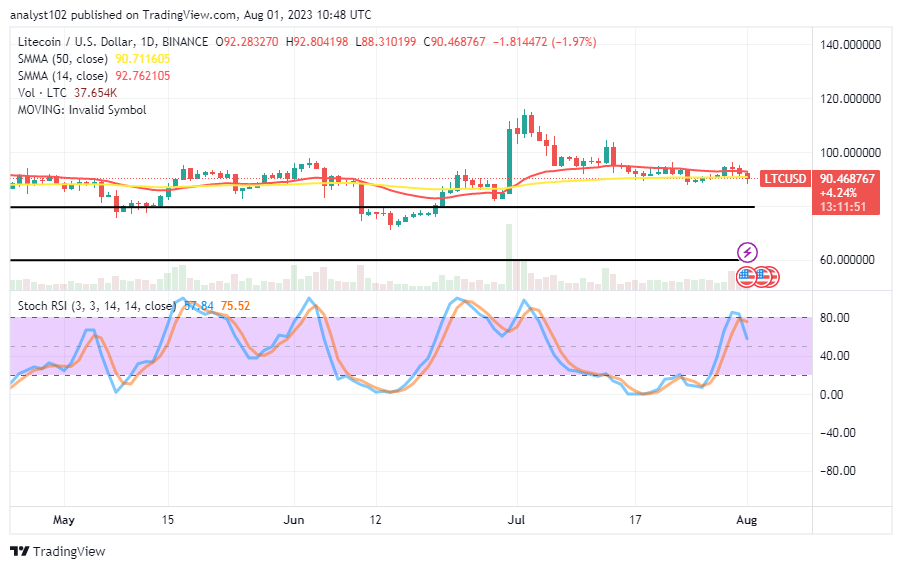
LTC/USD – Daily Chart
The LTC/USD daily chart reveals that the crypto-economic market descends, tending to hold for a short time toward the support line of $80.
The 14-day SMA indicator is at $92.762105, above the $90.711605 of the 50-day SMA indicator. The Stochastic oscillators initially touched part of the overbought region before positioning southbound from 75.52 to 57.84. Long-position pushers are facing a difficult moment to surge away from points between $85 and $80 supports.
Where does the trade barrier lie in relation to the existing LTC/USD trading gravity?
Basically, at this cycle of trading operations in the LTC/USD, the crypto-economic operations will possibly trade for a while under the resistance point of $100, given that the price currently descends below it, as it also holds for a short time.
The Stochastic Oscillators at this point predict that some fall-offs will dominate the market landscape; therefore, buying actions need to be put on hold for the time being. The underlying support level of $80 presents a long-term risk of exhaustion for the moves, which would then provide a window for bulls to re-enter the market.
Regarding the LTC/USD market’s continued downward trend, sellers needed to exercise caution while executing an immediate shorting order because the velocity to support such an entrance is so risky and the situation isn’t far from experiencing a time of indecisive trading.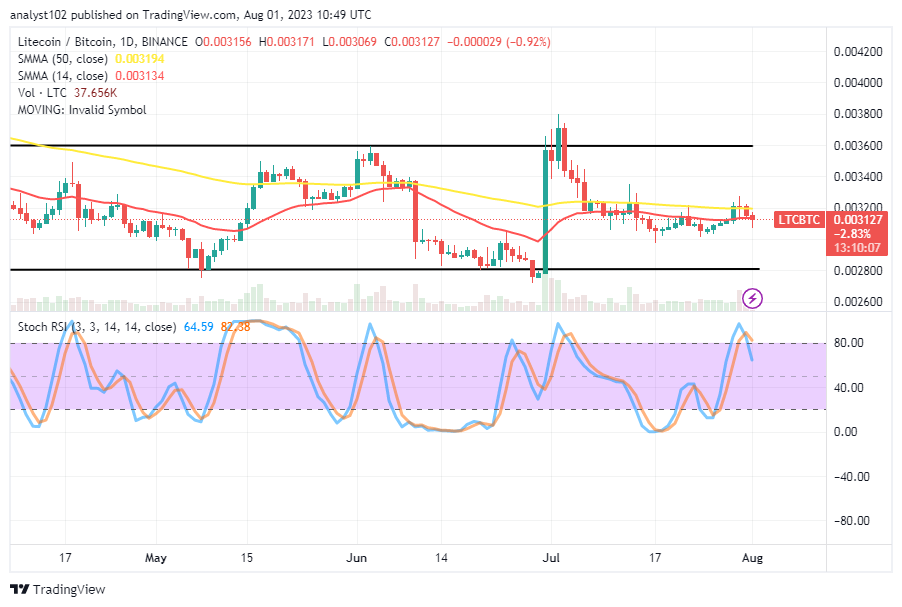
LTC/BTC Price Analysi
In contrast, Litecoin business descends, liable to hold for a short time against the price worth of Bitcoin around the trend lines of the Moving Averages.
Nearly above the 14-day SMA sign is the 50-day SMA indicator. And inside big range-bound regions, more of them are pointed east than any other way. The Stochastic Oscillators are positioned between 82.38 and 64.59 points in the overbought area and have made a minor southward movement. That suggests that the base cryptocurrency economy is starting to feel pressure from its counter-trading crypto instrument. The likelihood of witnessing the price decline to the previous bottom will be ruled out if a bullish candlestick appears along the current advance.
Note: Cryptosignals.org is not a financial advisor. Do your research before investing your funds in any financial asset or presented product or event. We are not responsible for your investing results.
You can purchase Lucky Block here. Buy LBLOCK