Polkadot Resumes Its Bullish Ascent as It Hovers above $10
Estimated Reading Time: 2 minutes
Don’t invest unless you’re prepared to lose all the money you invest. This is a high-risk investment and you are unlikely to be protected if something goes wrong. Take 2 minutes to learn more

Polkadot (DOT) Long-Term Analysis: Bullish
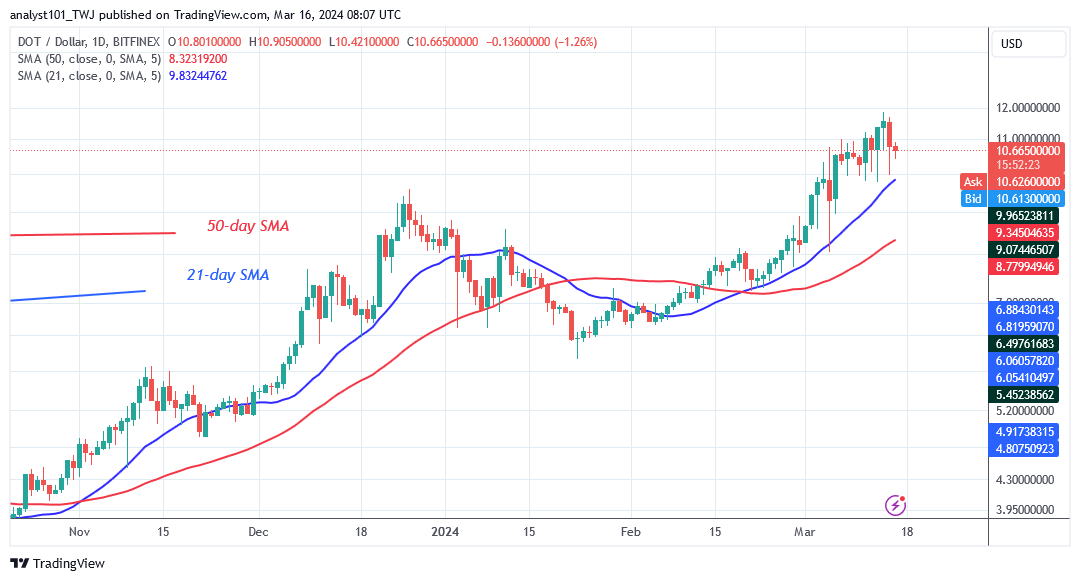
Polkadot’s (DOT) price has continued its upward trend as it hovers above $10. The DOT price has fallen as the altcoin approaches the $12 resistance zone. The altcoin is recovering from its recent downturn. The present upward trend will continue if the cryptocurrency price retraces and remains above the 21-day SMA.
On the upside, if buyers overcome the barrier below $12, the DOT price will rise and return to its prior high of $22.50. On the other hand, selling pressure will return if the altcoin retraces and drops below the 21-day SMA. The altcoin will fall above the 50-day SMA or the $8.35 support. Meanwhile, the altcoin is hovering just above the moving averages. The DOT price is worth $10.52 at the time of writing.
Technical indicators:
Major Resistance Levels – $10, $12, $14
Major Support Levels – $8, $6, $4
Polkadot (DOT) Indicator Analysis
Polkadot has retraced above the 21-day SMA following its latest dip.
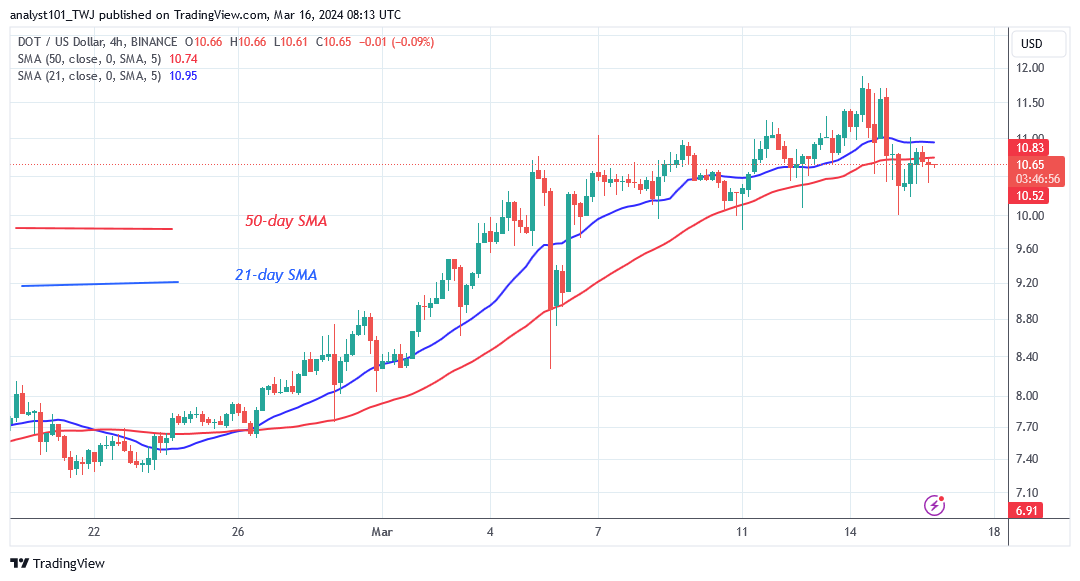
The price bars are just above the 21-day moving average line. The lengthy candlestick tail implies strong buying above the 21-day SMA support. On the 4-hour chart, the price bars are below the moving averages.
What Is the Next Direction for Polkadot (DOT)?
Polkadot is currently in decline and remains above the 21-day SMA as it hovers above $10. The crypto signal will be good if the altcoin remains above the 21-day SMA. This will allow the altcoin to resume its bullish trend. However, the crypto signal will be bearish if the price falls below the 21-day SMA on the daily chart.
You can purchase Lucky Block here. Buy LBLOCK
Note: Cryptosignals.org is not a financial advisor. Do your research before investing your funds in any financial asset or presented product or event. We are not responsible for your investing results