Bitcoin (BTC/USD) Market Runs in a Correctional Trend
Estimated Reading Time: 4 minutes
Don’t invest unless you’re prepared to lose all the money you invest. This is a high-risk investment and you are unlikely to be protected if something goes wrong. Take 2 minutes to learn more

Free Crypto Signals Channel
Bitcoin Price Prediction – April 13
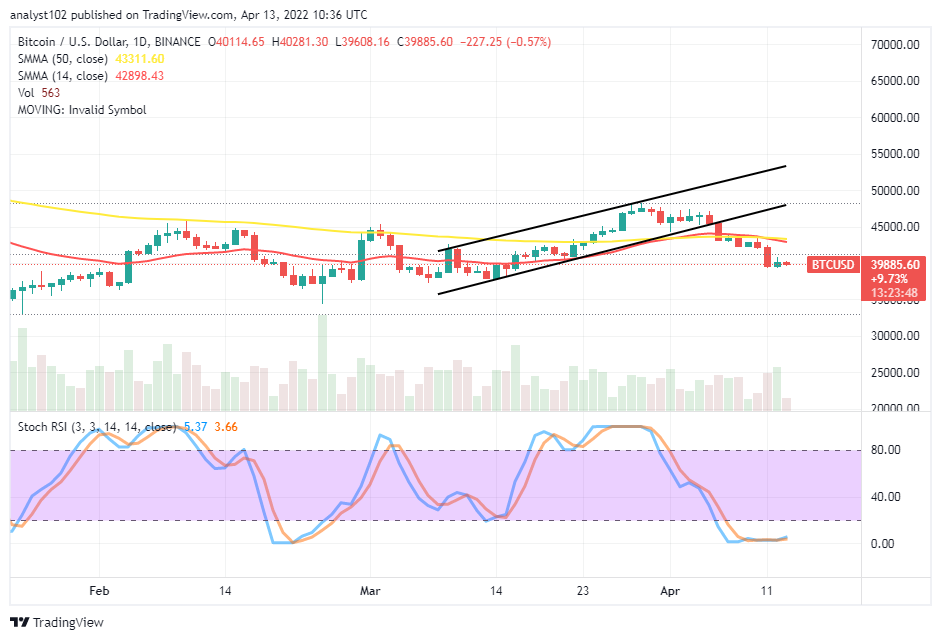
It observed the BTC/USD market operation runs in a correctional trend in place of capitalizing on the recent rallying motion that waged through some unexpected trading resistant lines. Price has been gathering efforts to go down past the $40,000 level, trading between $40,281 and $39,608 at a minimal negative percentage rate of 0.57.
BTC/USD Market
Key Levels:
Resistance levels: $42,500, $47,500, $50,000
Support levels: $37,500, $35,000, $32,500
BTC/USD – Daily Chart
The BTC/USD daily chart showcases the crypto-economic market runs in a correctional trend in its valuation. The motion took effect between the previous sessions of March 29 and 31 when the price failed to surge higher sustainably above the main resistance level of $47,500. The 14-day SMA has conjoined with the 50-day SMA attempting to bend southward closely above the $42,500 resistance line. The Stochastic Oscillators are in the oversold region with their lines conjoined, moving in a consolidation manner to indicate that a falling force is ongoing as of writing.Will the current pace of the forces to the downside suffice to get more downs as the BTC/USD market runs in a correctional trend?
As an oversold reading situation has been in the BTC/USD trade operations, the current pace of downside forces may linger on for a while. But, not expected to lead to passing through variant support levels in the process for the long-term run as the market runs in a correctional trend. Long-position takers may have to be on the lookout for a rebound in no time within trading space of 440,000 and $37,500 points. Traders may use lower trading charts such as 1-hour and 4-hour in determining an entry afterward.
On the downside of the technical analysis, the BTC/USD market short-position takers now face a condition that they have to consolidate their stances past below the $40,000 trading line in affirmation of their presence at the expense of the crypto’s weaknesses. While that presumed scenario is playing out, the $37,500 will be in focus by bears to force the market downside in the near time. A convergence of price around the value-line in the medium-term may potentially lead to invalidating getting sustainable downs.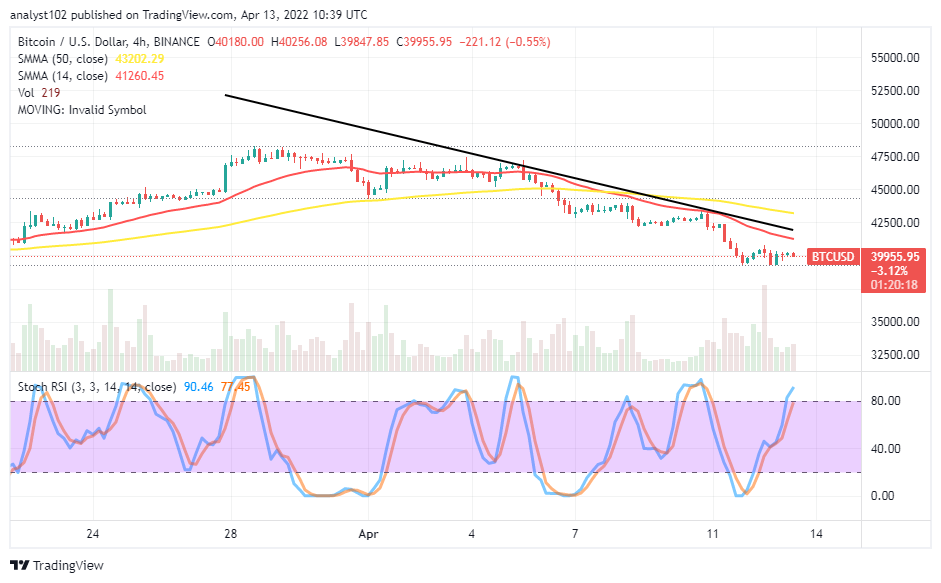 BTC/USD 4-hour Chart
The BTC/USD 4-hour chart has revealed the crypto market runs in a correctional trend, trading underneath the trend lines of the SMAs. The 14-day SMA indicator is beneath the 50-day SMA indicator. The bearish trend line drew closely above the smaller SMA to keep the downside path of the crypto economy. The Stochastic Oscillators have slightly moved past the range of 80 into the overbought region. And they are seemingly making an effort to close the lines soon around the range-line value. And that can lead to a pit stop in the business activities soon. Long-position placers needed to allow the market to take a respite to down in compliance with the Stochastic Oscillators moving to a lower range before getting a bullish candlestick signaling a return of upward swings.
Note: Cryptosignals.org is not a financial advisor. Do your research before investing your funds in any financial asset or presented product or event. We are not responsible for your investing results.
You can purchase Lucky Block here. Buy LBlock: