Cardano May Revisit $0.40 Low as It Breaks Current Support at $0.47
Estimated Reading Time: 2 minutes
Don’t invest unless you’re prepared to lose all the money you invest. This is a high-risk investment and you are unlikely to be protected if something goes wrong. Take 2 minutes to learn more

Free Crypto Signals Channel
Cardano (ADA) Long-Term Analysis: Bearish
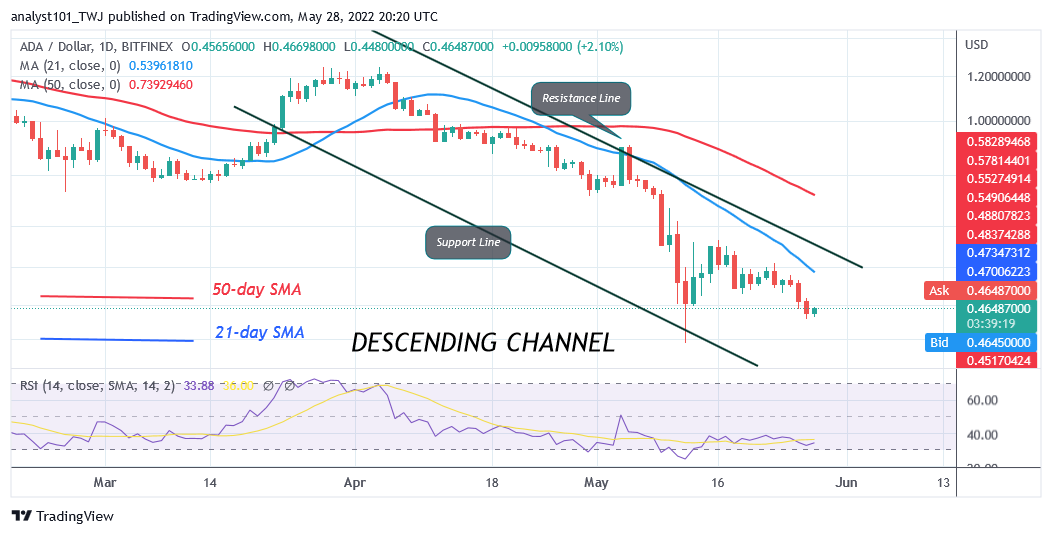
Cardano’s (ADA) price is in a downward correction as it breaks current support at $0.47. ADA price has recovered above the current support as buyers attempt to push the coin upward. For the past week, the altcoin has been trading between $0.40 and $0.60 price levels. Today, the upward move has been restricted by the 21-day line moving average. The 21-day line moving average is acting as a resistance level. On the upside, if price rebounds above the current support, it will break above the 21-day line SMA and rally to the 50-day line SMA. Conversely, the selling pressure will resume if ADA turns from the moving average.
Cardano (ADA) Indicator Analysis
Cardano is at level 33 of the Relative Strength Index for period 14. The altcoin is in the bearish trend zone and it is approaching the oversold region.ADA price is below the 20% range of the daily stochastic. Cardano is trading in the oversold region of the market.
Technical indicators:
Major supply zones: $2.0, $2.20, $2.40
Major demand zones: $1.40, $1.20, $1.00
What Is the Next Direction for Cardano (ADA)?
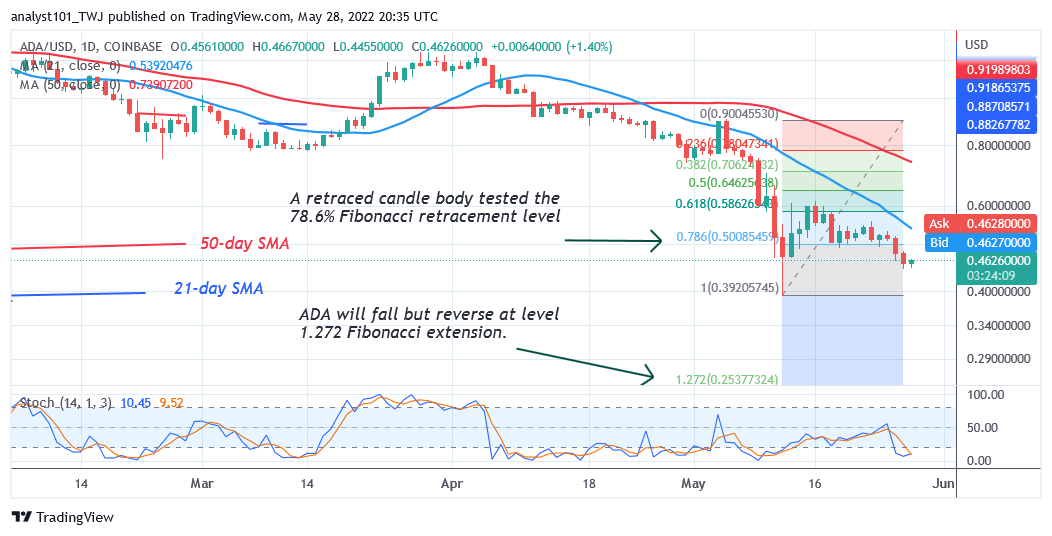
Cardano’s price is still in a downward correction as it breaks current support at $0.47. ADA’s price is attempting to revisit the previous low. Meanwhile, on May 12 downtrend; a retraced candle body tested the 78.6% Fibonacci retracement level. The retracement suggests that ADA will fall to level 1.272 Fibonacci extension or $0.25.
You can purchase crypto coins here. Buy LBlock
Note: Cryptosignals.org is not a financial advisor. Do your research before investing your funds in any financial asset or presented product or event. We are not responsible for your investing results