Quant Price Prediction: QNT/USD Ready to Reclaim $110 Resistance
Estimated Reading Time: 3 minutes
Don’t invest unless you’re prepared to lose all the money you invest. This is a high-risk investment and you are unlikely to be protected if something goes wrong. Take 2 minutes to learn more
Quant Price Prediction – July 4
The Quant price prediction shows that QNT keeps trading around $108, the bulls are ready to push the coin to hit the resistance level of $115.
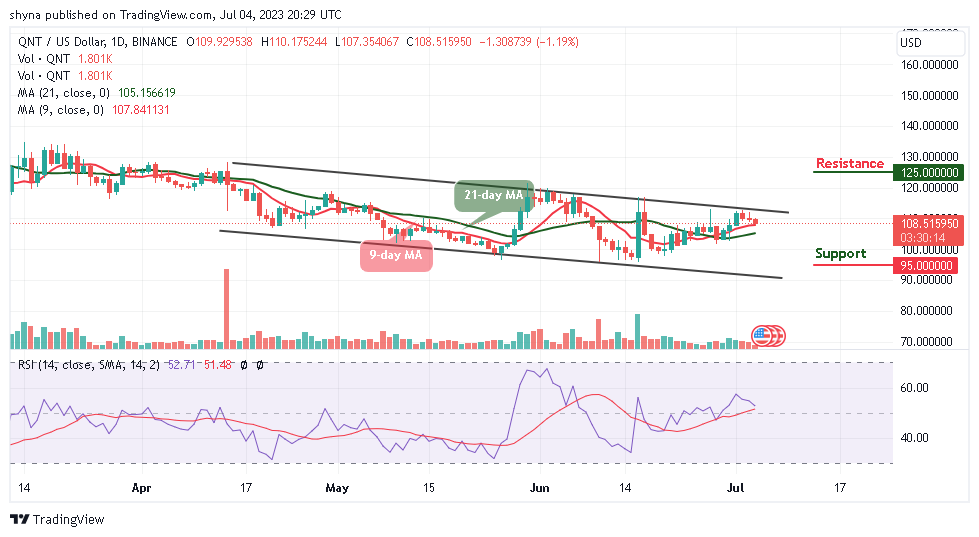
QNT/USD Long-term Trend: Ranging (Daily Chart)
Key levels:
Resistance Levels: $125, $130, $135
Support Levels: $95, $90, $85
QNT/USD will follow a bullish movement as the king coin remains above the 9-day and 21-day moving averages. At the beginning of today’s trading, the Quant price sees a slight rise toward the upside, and the Quant price hits the daily high at $110.1.
Quant Price Prediction: QNT Price Will Face the Upside
The Quant price is seen retracing and trading above the 9-day and 21-day moving averages as the market price prepares to move to the upside. However, any bullish cross above the upper boundary of the channel will increase the current market value to reach the nearest resistance at $115. The buyers may locate the potential resistance levels at $125, $130, and $135 if the bulls put in more effort.
In the meantime, if the resistance level of $110 fails to hold, it may reverse and face the support level of $105, further increase in the bears’ pressure may bring down the price below the lower boundary of the channel, and this could cause the coin to hit the support levels at $95, $90, and $85 respectively. Moreover, the technical indicator Relative Strength Index (14) is moving above the 50-level, suggesting sideways movement.
QNT/USD Medium-term Trend: Bullish (4H Chart)
According to the 4-hour chart, the Quant price hovers below the 9-day and 21-day moving averages of $108.6. The bulls can push the price above the upper boundary of the channel if they increase the buying pressure but any bearish movement toward the lower boundary of the channel could bring the coin to the support level of $104 and below.
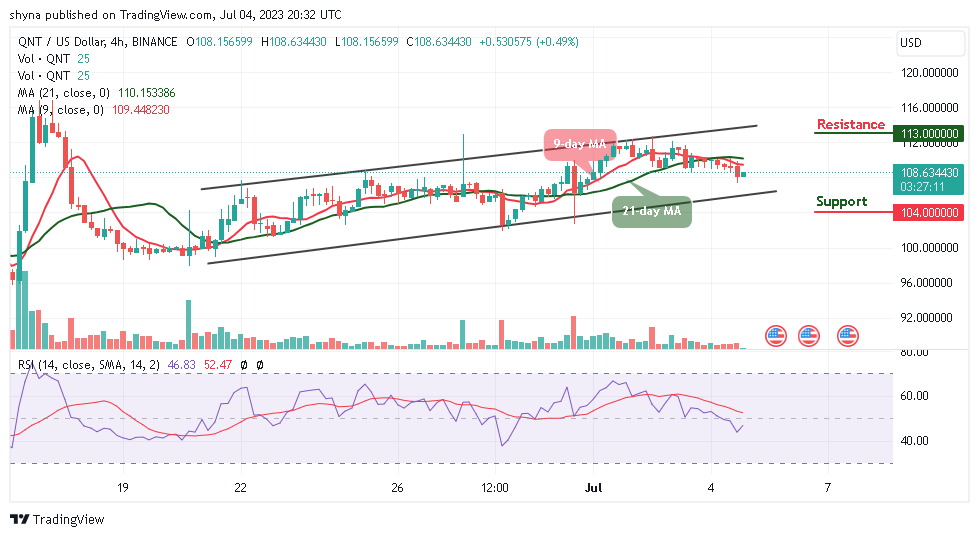
Moreover, if the Quant price finds a decent resistance level at $110 level, it will head to the north, which could hit the resistance level of $113 and above. Currently, the technical indicator Relative Strength Index (14) may follow the bullish movement as the signal line moves to cross above the 50-level.
Place winning Quant trades with us. Get QNT here