Solana (SOL/USD) Market Is Recovering From $30
Estimated Reading Time: 3 minutes
Don’t invest unless you’re prepared to lose all the money you invest. This is a high-risk investment and you are unlikely to be protected if something goes wrong. Take 2 minutes to learn more

Free Crypto Signals Channel
Solana Price Prediction – September 23
New dimensional running outlook in all pairing markets usually takes another turn after a particular trend. And on that note, the SOL/USD market has taken to a recovering from the $30 lower-trading line. Today’s session has witnessed a 1.11 percent, trading around $32.78 as of the time of writing.
SOL/USD Market
Key Levels:
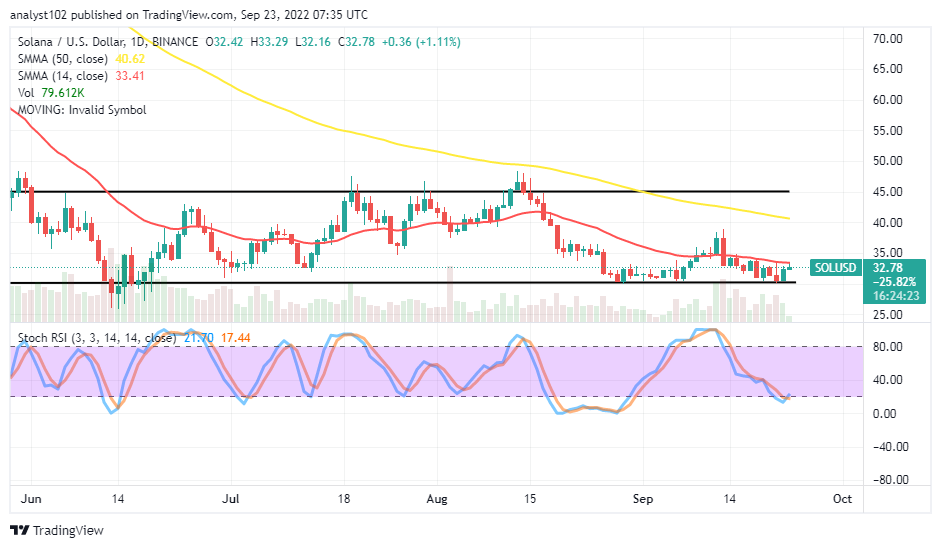
Resistance levels: $40, $45, $50
Support levels: $30, $25, $20
SOL/USD – Daily Chart
The SOL/USD daily chart reveals the crypto market is recovering from the $30 trading level as bulls’ effort to push northward from below the $40 resistance level was futile. Wider range-bound zones are spotted with three layers, numbering from $30, $35, $40, and $45. The 14-day SMA indicator is $33.41 underneath the 50-day SMA indicator is $40.62. The Stochastic Oscillators have crossed northbound from the range of $20 to 17.44 and 21.70 range values.
Will the SOL/USD market bulls push higher for more ups from its current trading point?
Indicators have been signaling positive uprisings in the following operations based on the formation of bullish candlesticks spanning northward from the $30 trading level since yesterday as the crypto market is recovering from the value line. Lots of buying momentums appear, garnering to project near increases of the trade past above the trend line of the 14-day SMA. Bulls have to their baseline firmly against the possibility of declining at the lower horizontal line drawn.
On the downside of the technical analysis, the current trading pattern outlook shows the SOL/USD market bears are to lose add-ons to their force to break down through the $30 support level after touching around it recently. Sort-position placers are expectantly patient toward getting an outer resistance-trading outlook to form at a high zone in the long run.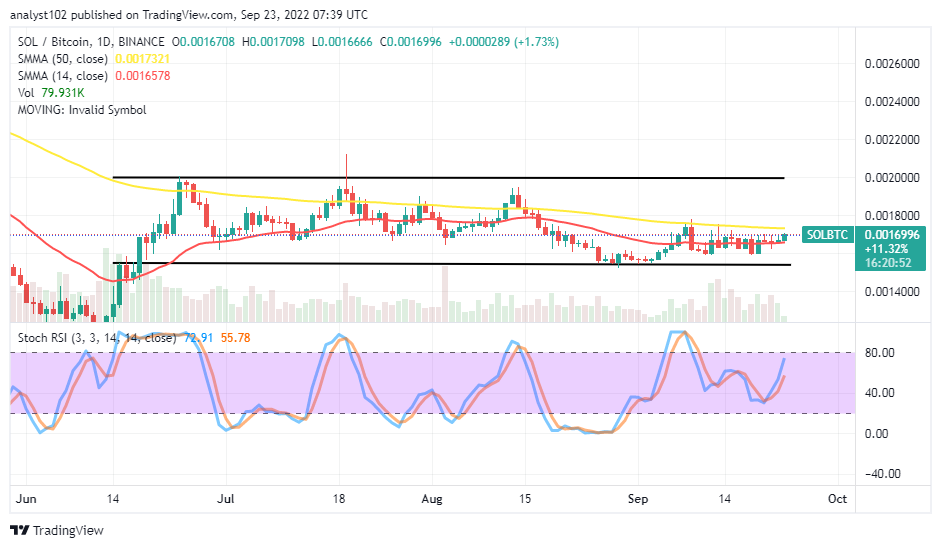
SOL/BTC Price Analysis
Solana is not giving much chance to downsize against Bitcoin’s trending force in the high-trading zone. The 14-day SMA indicator is below the 50-day SMA indicator. A bullish candlestick is in the making to suggest the former trading instrument is striving for some ups against its bigger-SMA trend line. The Stochastic Oscillators have crossed northbound from a near point below the range of 40 to reach 55.78 and 72.91 range values. Northward pushes are, to some reasonable extent holding stronger between the pairing crypto instruments as of the time of writing.
Note: Cryptosignals.org is not a financial advisor. Do your research before investing your funds in any financial asset or presented product or event. We are not responsible for your investing results.
You can purchase Lucky Block here. Buy LBLOCK