Binance Coin Circles above $300 as It Faces Rejection at a Recent High
Estimated Reading Time: 2 minutes
Don’t invest unless you’re prepared to lose all the money you invest. This is a high-risk investment and you are unlikely to be protected if something goes wrong. Take 2 minutes to learn more
Binance Coin (BNB) Long-Term Analysis: Bearish
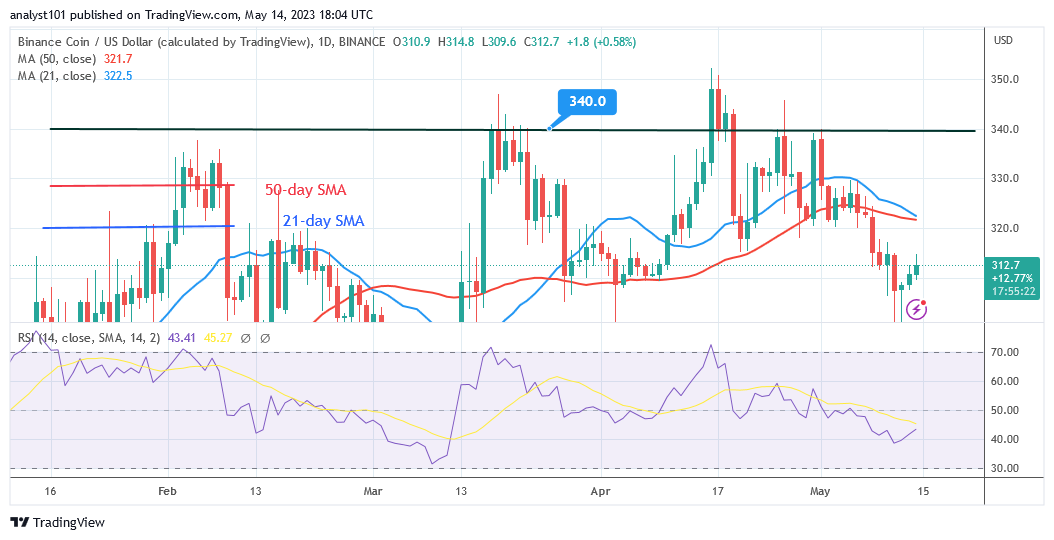
Binance Coin (BNB) price has dropped to the necessary $300 support as it faces rejection at a recent high. BNB has been retesting the $300 support and the overhead resistance at $340 since February 13. At the time of writing, the altcoin has reached a high of $311. On the upside, the resistance at $315 is preventing the altcoin from moving much higher. BNB hit a low of $302 on May 10 but was repelled at the same resistance level. If the initial resistance level is broken, the altcoin will increase. In the oversold area of the market, BNB is retracing downward toward the $300 support level.
Binance Coin (BNB) Indicator Analysis
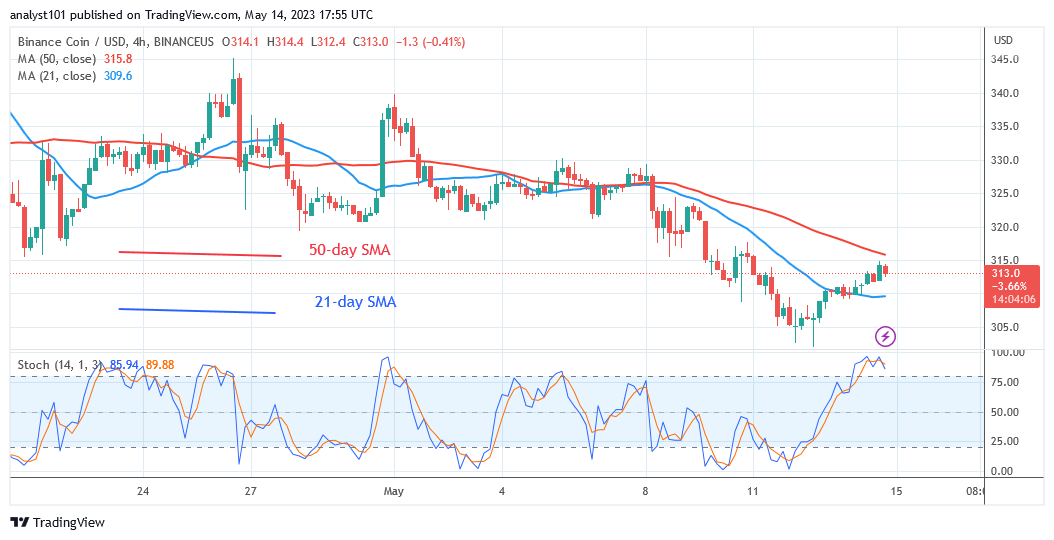
On the Relative Strength Index for period 14, BNB is at level 43. The altcoin is still moving sideways while in the bearish trend zone, and the RSI has not changed. The moving average lines are below the price bars, which leads the altcoin to fall. Below the daily Stochastic threshold 80, the alternative currency is experiencing bearish momentum. The coin will probably fall out.
Technical indicators:
Major Resistance Levels – $440, $460, $480
Major Support Levels – $240, $220, $200
What Is the Next Direction for Binance Coin (BNB)?
Binance Coin is circling over the $300 level that is serving as support. BNB is pinned between the moving average lines on the 4-hour chart. The cryptocurrency has been limited between the moving average lines since May 13. When the moving average lines are broken, the altcoin will trend.
You can purchase crypto coins here. Buy LBLOCK
Note: Cryptosignals.org is not a financial advisor. Do your research before investing your funds in any financial asset or presented product or event. We are not responsible for your

