Quant Price Prediction: QNT/USD May Find Comfort in the Bearish Zone
Estimated Reading Time: 2 minutes
Don’t invest unless you’re prepared to lose all the money you invest. This is a high-risk investment and you are unlikely to be protected if something goes wrong. Take 2 minutes to learn more
Quant Price Prediction – June 20
The Quant price is down by 0.46% over the last 24 hours. The next support of the coin may likely come at the $95 level.
QNT/USD Market
Key Levels:
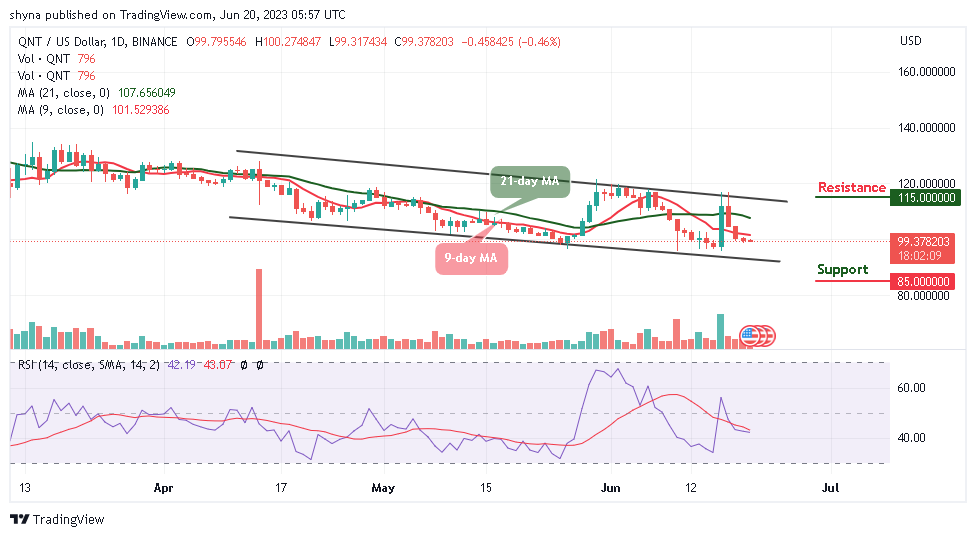
Resistance levels: $115, $120, $125
Support levels: $85, $80, $75
QNT/USD is falling beneath the long-term support at $99.30, which is now subjected to the price actions below the 9-day and 21-day moving averages over the past few days of trading. As the bears take charge, the coin may lose momentum to the lower side of the channel along with a potential price surge. Meanwhile, the daily chart’s technical indicator Relative Strength Index (14) is bearish and continues to issue sell signals.
Quant Price Prediction: Quant (QNT) May Fall More
According to the daily chart, if the Quant price decides to stay under the control of bears, the price may likely drop to the nearest supports at $85, $70, and $75. On the upside, the bulls need to push the market price above the 9-day and 21-day moving averages to reach the potential resistance levels of $115, $120, and $125.
QNT/USD Medium-term Trend: Ranging (4H Chart)
Looking at the 4-hour chart, the Quant market stays below the 9-day and 21-day moving averages within the channel where the price is expected to break above the 9-day moving average. Therefore, should the price move to the negative side, the market could experience more downtrend if it crosses below the lower boundary of the channel, which could touch the nearest support level of $85 and below.
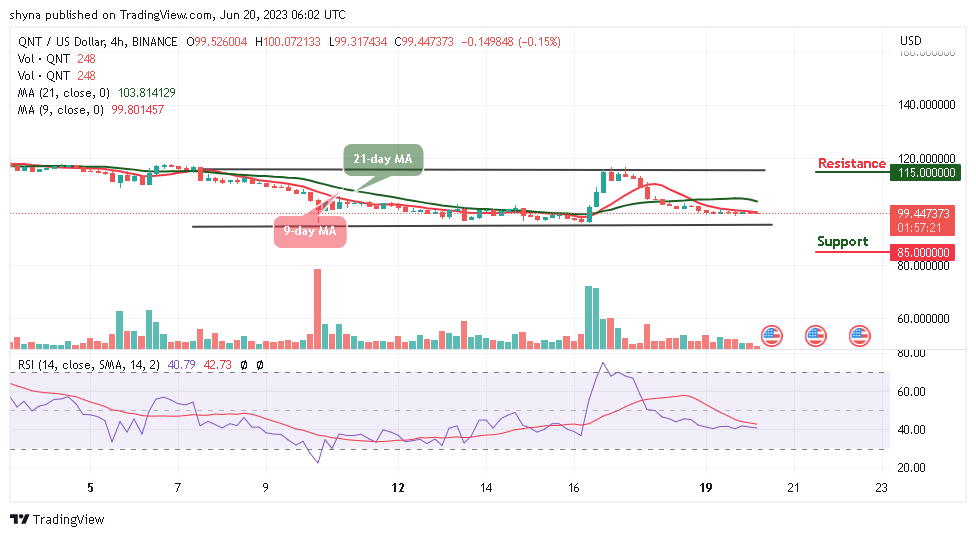
On the contrary, if the bulls could manage and push the market toward the north, it could spike above the 9-day and 21-day moving averages. If successful, the QNT price may reach the resistance level of $115 and above. Moreover, the technical indicator Relative Strength Index (14) confirms that the market is been controlled by the sellers as the signal line moves to cross below the 40-level.
Place winning Quant trades with us. Get QNT here

