Polkadot (DOT/USDT) Hints at a Potential Short-term Correction Towards $7.500
Estimated Reading Time: 3 minutes
Don’t invest unless you’re prepared to lose all the money you invest. This is a high-risk investment and you are unlikely to be protected if something goes wrong. Take 2 minutes to learn more
Polkadot Long-term Analysis: Bullish
The Polkadot (DOT/USDT) market has been volatile in recent weeks, reflecting broader market uncertainty and shifts in market sentiment. The price of DOT has seen a sharp increase since September, breaking above a series of resistances in the process. However, recent price actions suggest the pair is facing some difficulty at $9.552, as the current uptrend may experience a pause.be facing some difficulty at $9.552, as the current uptrend may experience a pause.
To this, recent price movements around the upper band and lines of the Stochastic RSI suggest the possibility of a short-term correction on the horizon as the bullish momentum wanes.
Currently, Polkadot is trading at $9.290 with a price dip of 10.60%.
Technical Indicators
Major Resistance Levels: $9.552, $10.393, and $11.000
Major Support Levels: $8.850, $7.500, and $5.470
Polkadot Technical Analysis
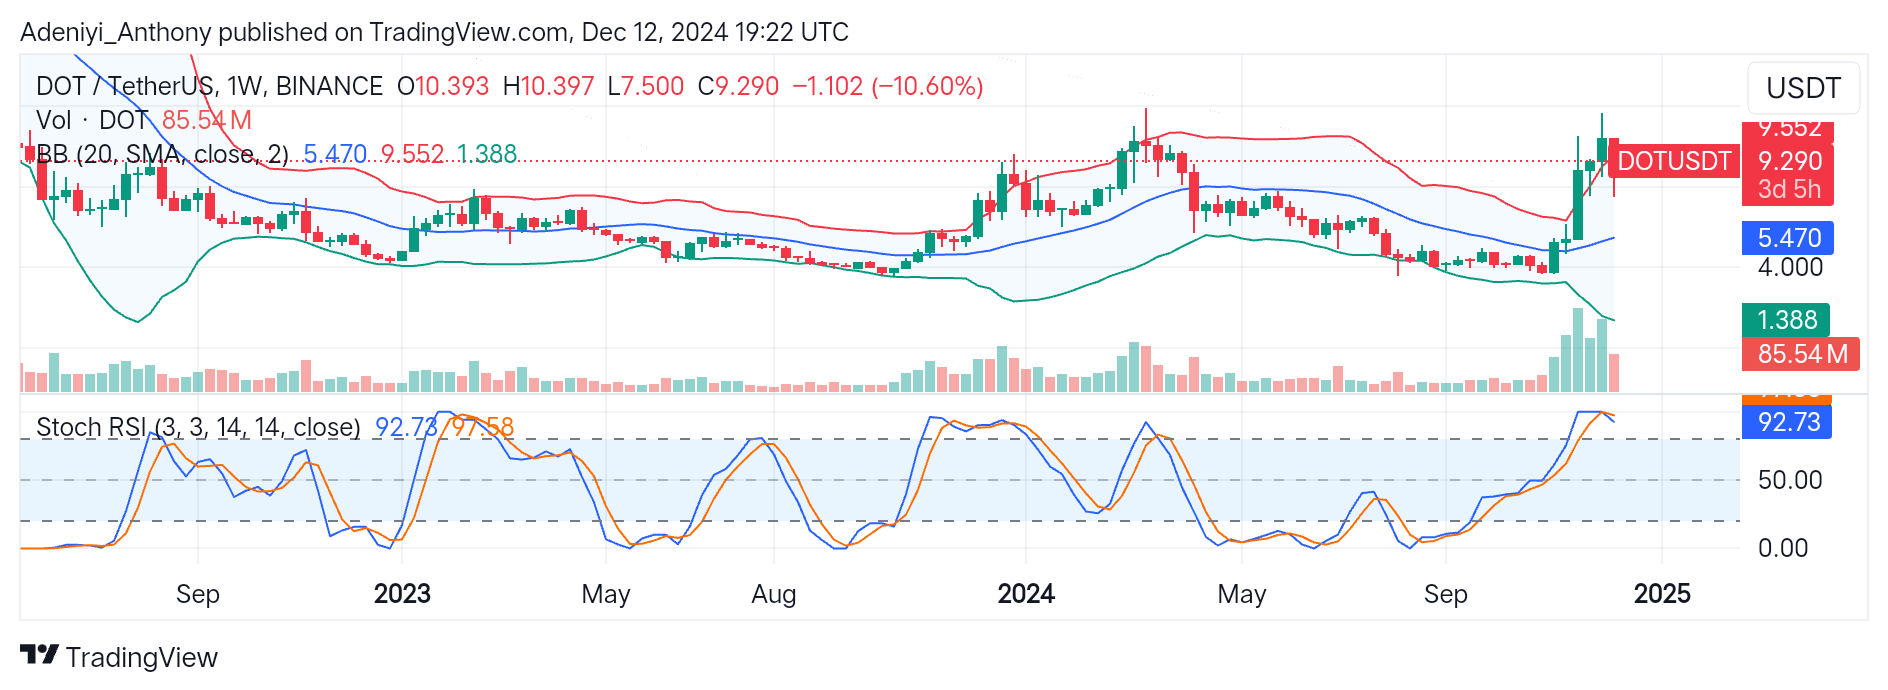
The analysis of Polkadot against the Tether on a weekly timeframe shows that the pair has recently experienced an uptrend. However, the widening of the Bollinger bands signals that potential price volatility is near.
The Stochastic RSI also suggests an impending take-profit action as the indicator shows the pair is overbought.
To this end, as the price struggles to break above the immediate resistance, a movement towards $5.470 is imminent. However, if trading volume increases beyond 85.54 million, the $10.393 may be the next target.
DOT/USDT Analysis: Expectations
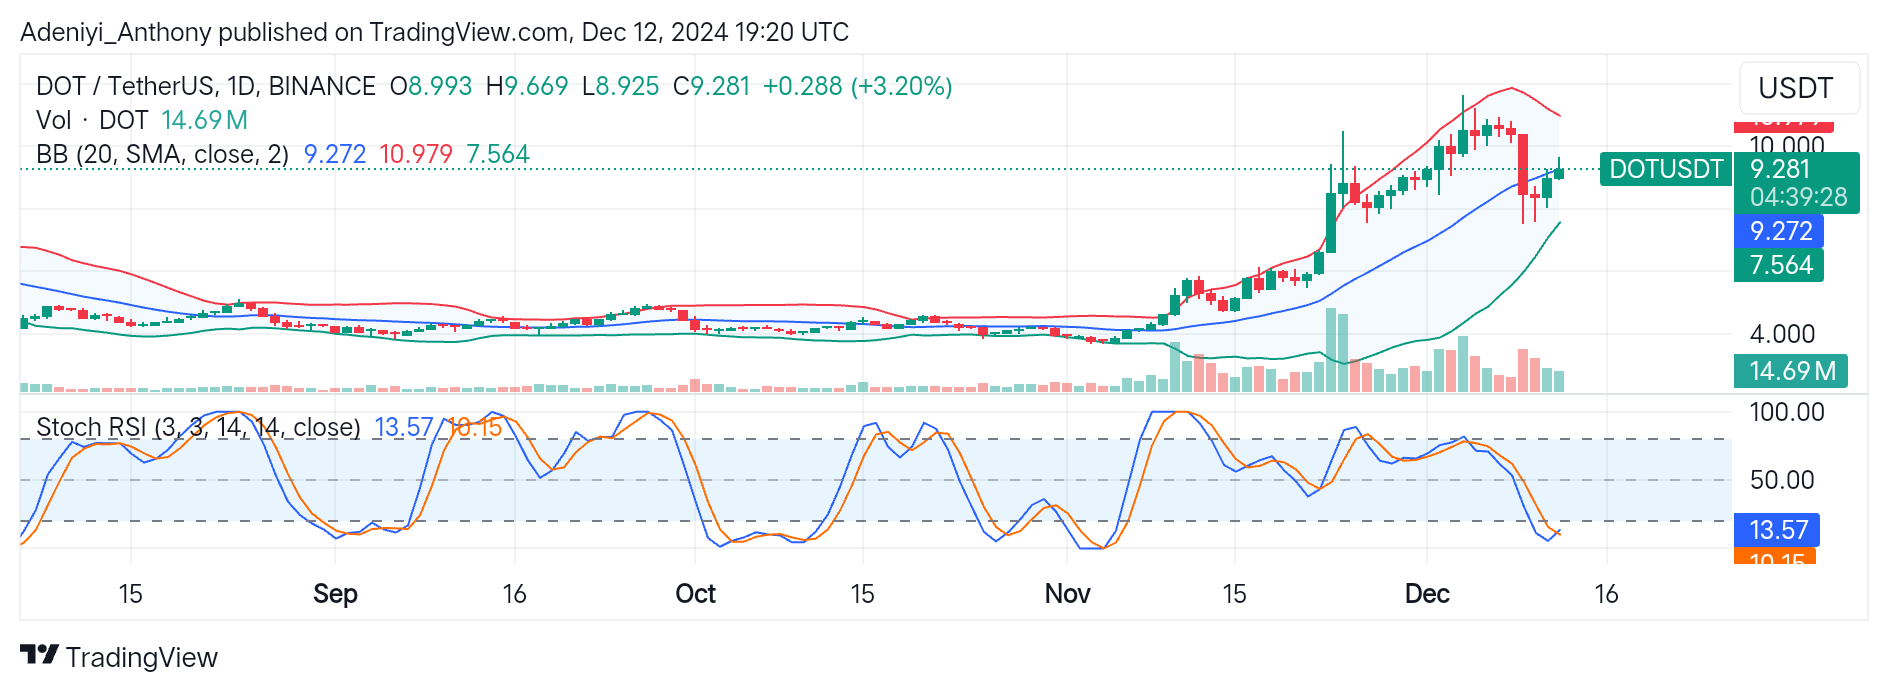
On the daily timeframe, the DOT/USDT pair has shown resilience by rallying to reclaim a critical level after seeing a sharp decline in recent trading sessions. However, the price seems to be slowing down despite the late-November recovery.
Therefore, as the Bollinger band squeezes, traders should expect a sharp price movement in the near term. Currently, the price tends to stabilize above $9.272 but needs fresh buying momentum; otherwise, a retracement to the lower band at $7.564 is possible.
On the other hand, the Stochastic oscillator signals the pair is on a short-term upside recovery, suggesting a bullish divergence. However, if this momentum is sustained, DOT could challenge the $10.000 resistance level. Conversely, failure to sustain the current uptick over and above the mid-band at $9.272 may rekindle potential selling pressure.
You can purchase crypto coins here. Buy LBlock