Polkadot (DOT/USDT) Targets the $10.00 Psychological Level Amid Overbought Signal
Estimated Reading Time: 3 minutes
Don’t invest unless you’re prepared to lose all the money you invest. This is a high-risk investment and you are unlikely to be protected if something goes wrong. Take 2 minutes to learn more
Polkadot Long-term Analysis: Bullish
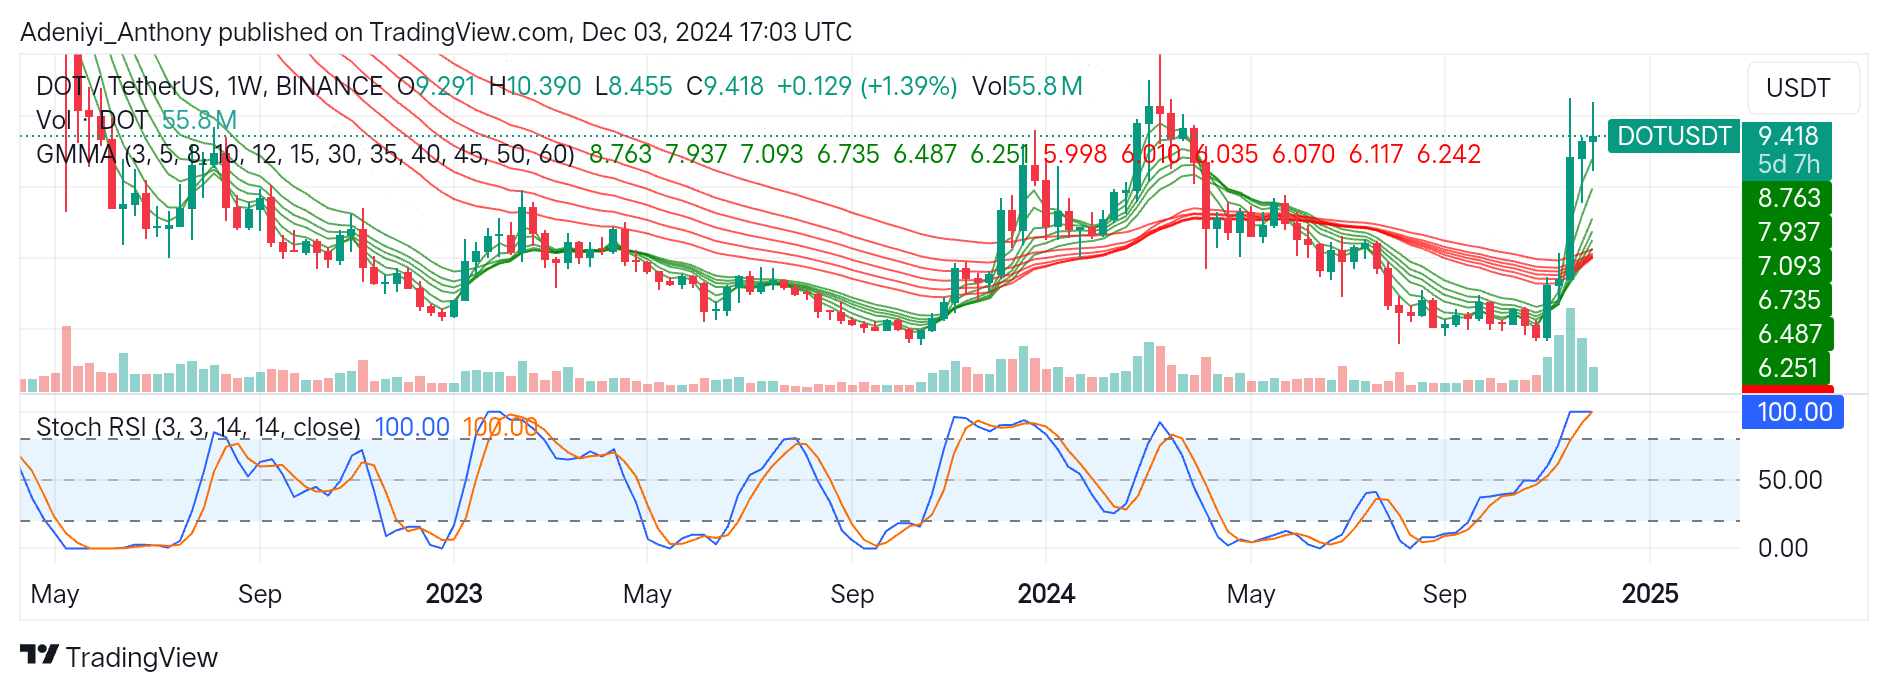
The general market sentiment of Polkadot against the Tether shows a significant bullish breakout after a prolonged period of consolidation. The current price movement suggests strong upward momentum, supported by increased volume with a positive crossover in the Stochastic RSI.
Recent price movement shows the pair is trending upward and above the Guppy Multiple Moving Averages (GMMAs). This signals renewed interest and buying pressure. However, the overbought condition of the Stochastic RSI indicates there might be a price dip in the near term.
Currently, Polkadot is trading at $9.418 with 55.8 million traded volumes.
Technical Indicators
Major Resistance Levels: $10.39, $11.00, and $12.00
Major Support Levels: $8.76, $7.09, and $6.73
Polkadot Technical Analysis
The analysis of the Polkadot versus Tether on a weekly timeframe shows that the pair is experiencing a breakout from the previous consolidation phase with a target on the $10.00 level, the next resistance level. However, the current price and the positioning of the GMMA suggest the upward trajectory has bullish backing. Therefore, a sustained volume and momentum would guarantee price breaking above the $10.00 level for other resistance levels.
On the other hand, the Stochastic RSI suggests the pair is operating in the overbought region, and the possibility of a pullback looms. Therefore, a pullback towards the immediate support level at $8.76 is possible before further upside.
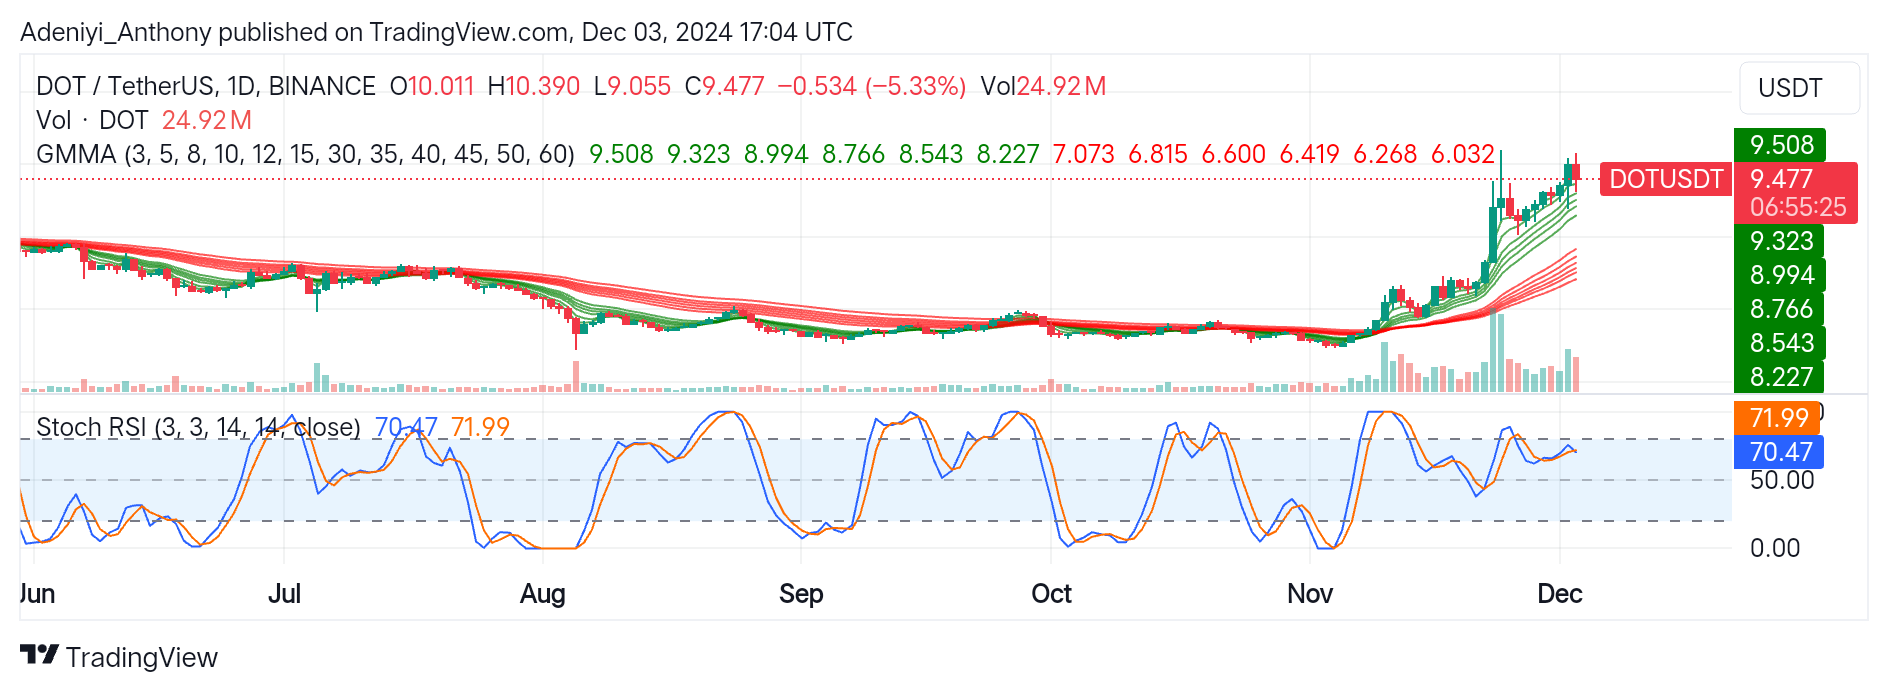
DOT/USDT Analysis: Will DOT Sustain its Momentum or Face a Pullback?
The daily chart for DOT/USDT reveals a pullback following a strong bullish rally. The price on the daily timeframe is testing a critical resistance at $9.508. Although the market remains positive, as the shorter EMAs are still above the longer EMAs, the Stochastic oscillator suggests a cautious trade as bullish pressure seems to be waning.
To this end, traders should watch the $9.23 level and a noticeable change in the trading volume for confirmation of a short-term pullback. Conversely, a break above the $9.508 would indicate a renewed bullish interest towards the $10.39 level.
You can purchase crypto coins here. Buy LBlock