Polkadot Resumes Its Upward Trend as It Clears the $10.31 High
Estimated Reading Time: 2 minutes
Don’t invest unless you’re prepared to lose all the money you invest. This is a high-risk investment and you are unlikely to be protected if something goes wrong. Take 2 minutes to learn more

Polkadot (DOT) Long-Term Analysis: Bullish
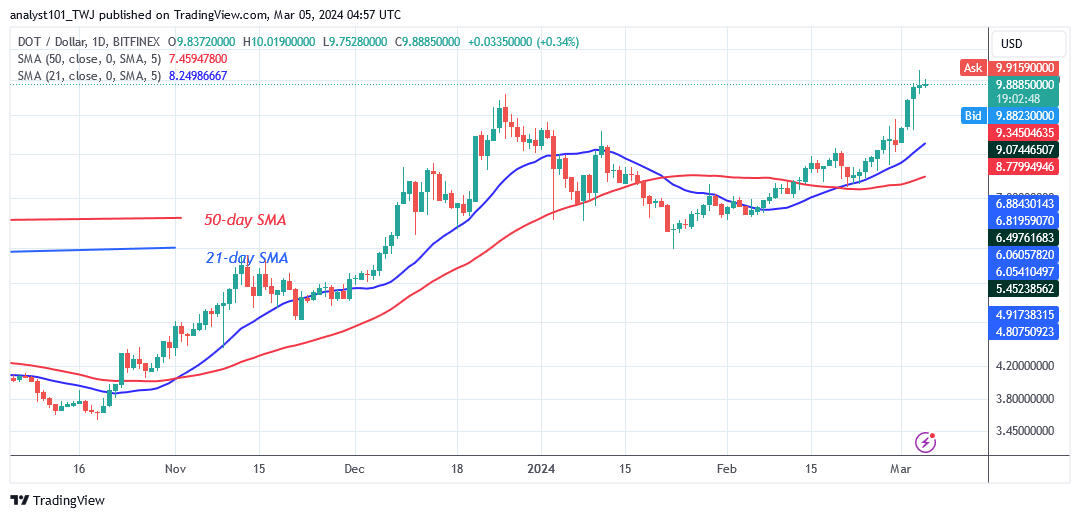
Polkadot’s (DOT) price breaks above the initial obstacle at $8.20, the resistance at $9.58, and clearing the $10.31 high. As a result, the positive momentum has extended to a high of $10.21. The cryptocurrency’s sideways pattern has come to an end with the current price rise. The altcoin is recovering from its earlier downtrend.
The current rise will continue, although resistance will be found at the $17 and $23 highs. Nonetheless, if the altcoin is rejected at the recent high, it will retrace above the $9.58 breakout mark. In the meantime, the current rise continues.
Technical indicators:
Major Resistance Levels – $10, $12, $14
Major Support Levels – $8, $6, $4
Polkadot (DOT) Indicator Analysis
The cryptocurrency price has rebounded above the horizontal moving average lines. This has led the price bars to be far above the moving average lines. The altcoin has a bullish crossing, meaning the 21-day SMA has crossed above the 50-day SMA, giving a positive indication.
What Is the Next Direction for Polkadot (DOT)?
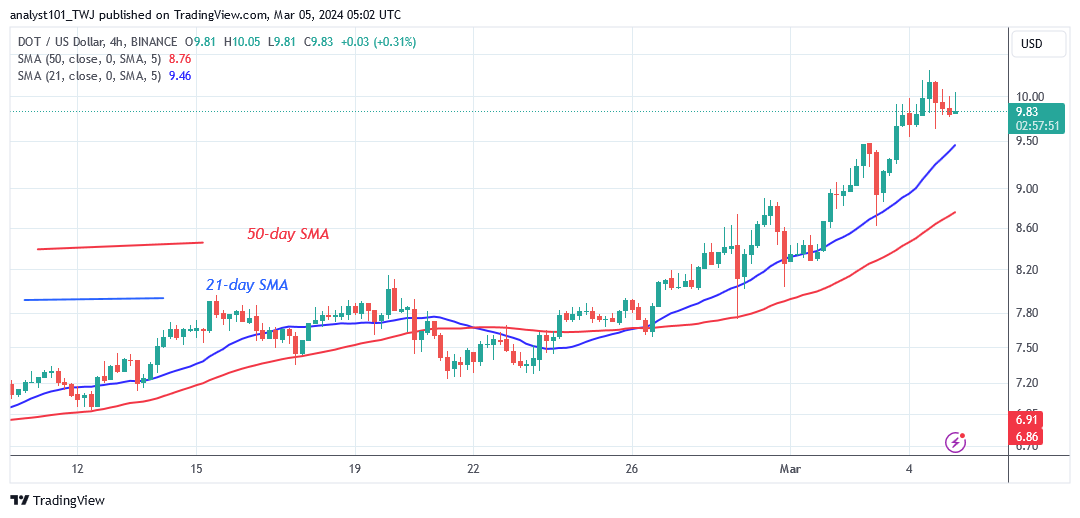
Polkadot has resumed its upward trend as it clears the $10.31 high. On the 4-hour chart, DOT price has risen to the high of $ 10.31 on March 4. The cryptocurrency’s price has been rising for the last 48 hours, retesting the previous high. The crypto signal will return bullish as buyers overcome the resistance at $10.31.
You can purchase Lucky Block here. Buy LBLOCK
Note: Cryptosignals.org is not a financial advisor. Do your research before investing your funds in any financial asset or presented product or event. We are not responsible for your investing results

