Bitcoin Price Prediction: BTC/USD Touches $44,000; Bulls May Blow Hot
Estimated Reading Time: 3 minutes
Don’t invest unless you’re prepared to lose all the money you invest. This is a high-risk investment and you are unlikely to be protected if something goes wrong. Take 2 minutes to learn more
Bitcoin Price Prediction – December 6
With Bitcoin price prediction shooting above $44,000 now, it is doing a little to flip the market sentiment at this stage.
BTC/USD Long-term Trend: Bullish (Daily Chart)
Key levels:
Resistance Levels: $49,000, $51,000, $53,000
Support Levels: $39,000, $37,000, $35,000
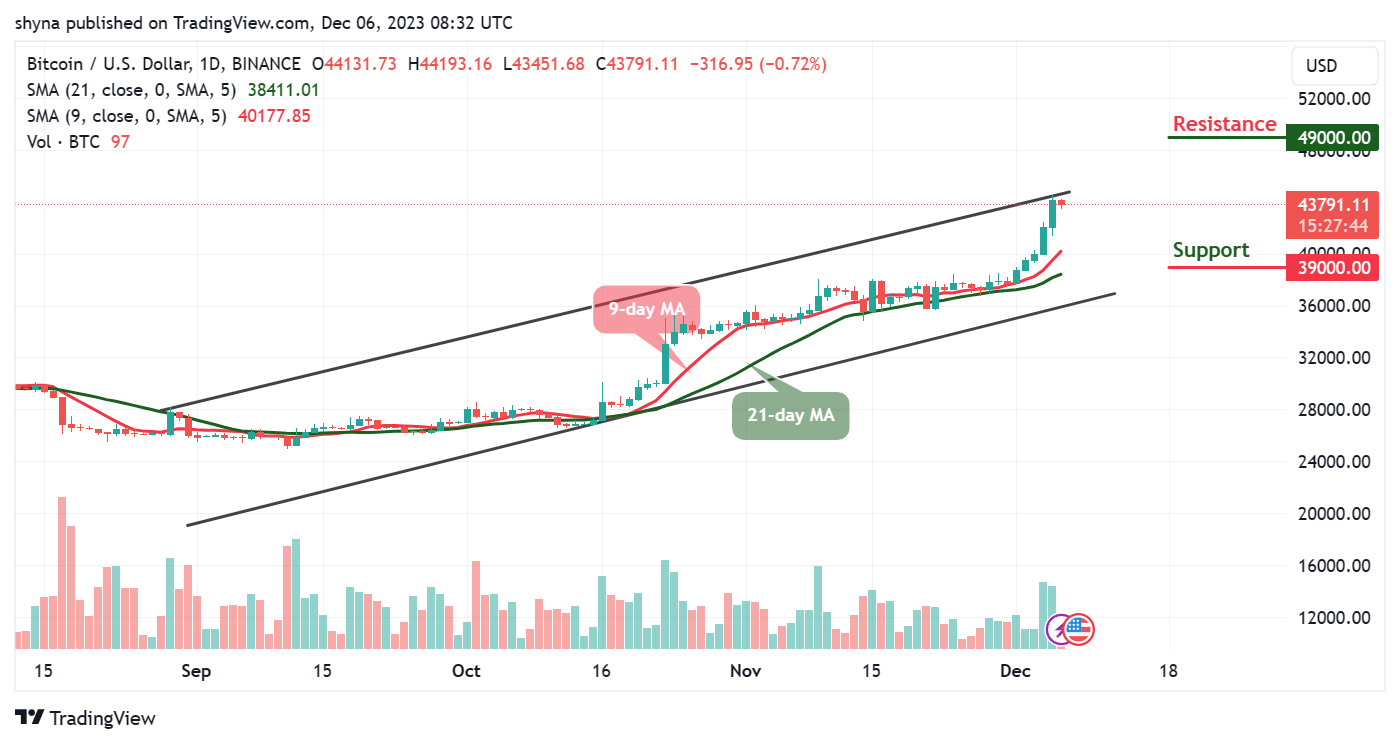
Looking at the daily chart, BTC/USD is correcting gains from $44,193 and begins to start a new increase above the 9-day and 21-day moving averages. During the European session today, the Bitcoin price begins a steady increase above the opening price of $44,131 resistance level as the coin touches the daily high at $44,193. Now, BTC/USD is likely to settle above the upper boundary of the channel.
Bitcoin Price Prediction: Would BTC Price Move Higher?
The Bitcoin price is currently retracing and aiming to surpass the upper boundary of the channel. This upward movement is evident as the market price breaks through the $44,150 resistance, indicating a bullish momentum. However, sustained bullish activity could propel the price beyond this level, encountering additional resistance at $46,000, and subsequently targeting potential resistance levels at $49,000, $51,000, and $53,000.
Conversely, should the $44,200 resistance falter, a reversal might occur, leading the price toward the support level of $43,000. If bearish pressure intensifies, there’s a possibility of the price dipping below the moving averages, potentially testing critical support levels at $39,000, $37,000, and $35,000. Meanwhile, the 9-day Moving Average (MA) maintains a position above the 21-day MA, signaling an increase in buy signals. This alignment suggests a prevailing positive trend in the short term.
BTC/USD Medium-term Trend: Bullish (4H Chart)
According to the 4-hour chart, the Bitcoin price is seen trading above the 9-day and 21-day moving averages at $43,849. However, at the time of writing, BTC/USD is trading toward the upper boundary of the channel but any bearish movement below the lower boundary of the channel could drag the coin to the support at $40,000 and below.
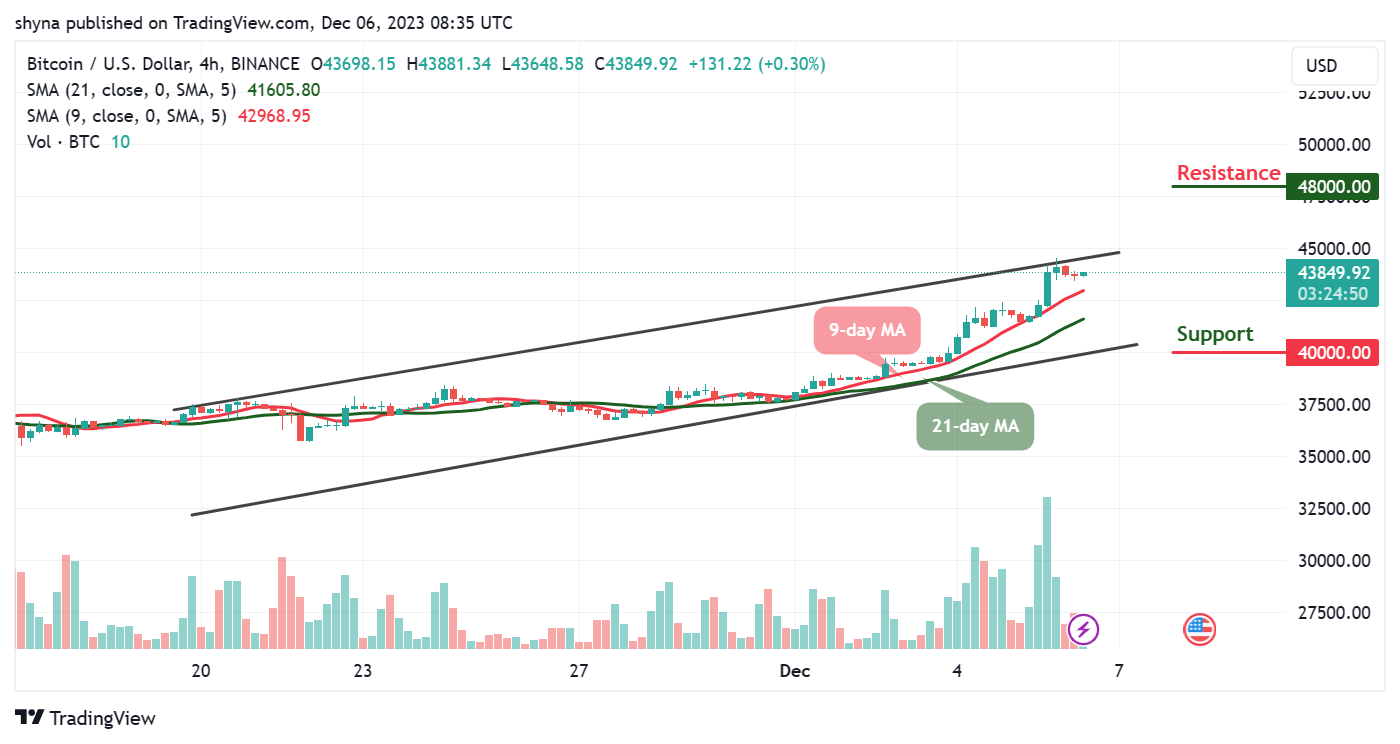
Meanwhile, if Bitcoin (BTC) finds a decent resistance level above the $44,200 level, it could increase the bullish movement which may likely push the price to the resistance level of $48,000 and above. On that note, the 9-day MA is seen above the 21-day MA, suggesting additional bullish signals into the market.
You can purchase Bitcoin here. Buy BTC