$SPONGE (SPONGE/USD) Rebounds, Trying to Reclaim $0.0002
Estimated Reading Time: 3 minutes
Don’t invest unless you’re prepared to lose all the money you invest. This is a high-risk investment and you are unlikely to be protected if something goes wrong. Take 2 minutes to learn more
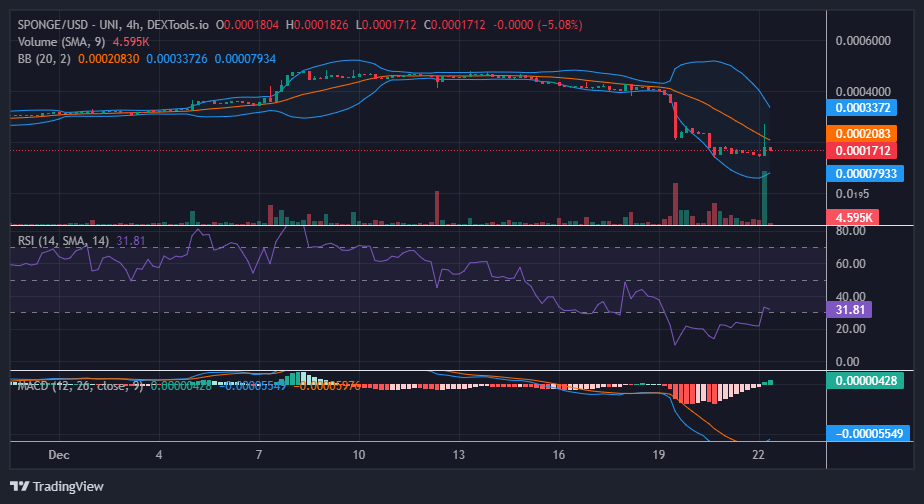
In the $SPONGE market, following an aggressive bearish trend that pushed the market below the anticipated support level of $0.0002, which was expected to serve as a foundation for bullish momentum, the bulls demonstrated resilience just below this pivotal point. While the market experienced a significant bullish surge earlier today, driving the price above $0.0002, such levels proved to be unsustainable, leading to a subsequent decline below this threshold.
Key Price Levels:
- Resistance: $0.00047, $0.00050, and $0.00060.
- Support: $0.000350, $0.00030, and $0.00025.
Technical Analysis for $SPONGE (SPONGE/USD):
Earlier today, bearish tendencies were evident in the $SPONGE market, as indicated by the pronounced upper shadow on the candlestick of the second 4-hour session. During the initial segment of the second 4-hour session, characterized by significant bullish sentiment, a divergence was observed between the bullish candlestick and the robust histogram of the volume of trade indicator for that timeframe. Such a divergence typically indicates underlying selling pressure, and bearish traders eventually gained the upper hand in the second half of the particular 4-hour session, which explains the appearance of the upper shadow on the candlestick. Currently, with the market trading near $0.00017, there has been a notable decrease in trading volume, signaling waning bearish momentum. Given the market’s proximity to oversold conditions, as suggested by the Relative Strength Index, there remains a strong potential for an imminent bullish recovery.
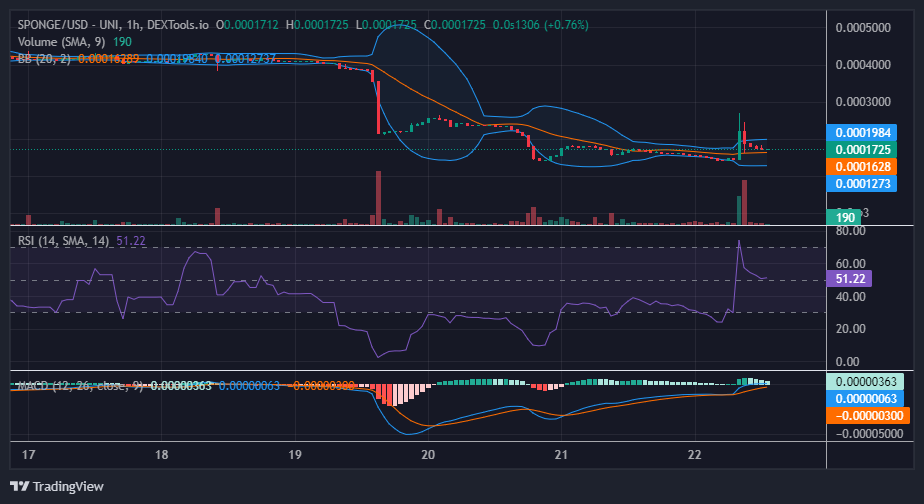
Short-Term Projection on the 1-Hour Chart:
The 1-hour chart currently displays bullish support forming around the $0.00017 mark. This support level represents an uplifted base compared to the recent support around $0.00014, which previously reversed the market’s downward trend. At present, the price appears to be in equilibrium between demand and support. As trading volume diminishes, there is potential for consolidation around this level, potentially solidifying it as a robust support level. Establishing such a support would empower the $SPONGE bulls, potentially propelling the price back above the $0.0002 threshold and reinstating bullish momentum.
They are completely outmatched.
They don’t stand a chance 😎💦🧽
#$SPONGE #MemeCoin #Crypto pic.twitter.com/ON73GMzb7n
— $SPONGE (@spongeoneth) December 22, 2023
Invest in the hottest and best meme coin. Buy Sponge ($SPONGE) today!