Polygon (MATIC/USD) Trade Is Ranging, Positioning to Recover
Estimated Reading Time: 3 minutes
Don’t invest unless you’re prepared to lose all the money you invest. This is a high-risk investment and you are unlikely to be protected if something goes wrong. Take 2 minutes to learn more
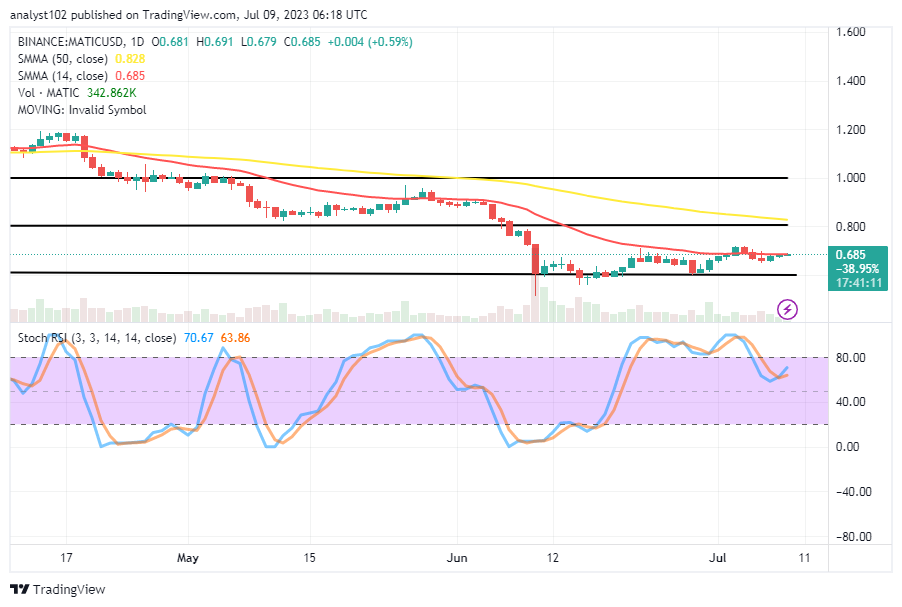
Polygon Price Prediction – July 9
The MATIC/USD market buyers reactions in the business organization have been beaten to end their valuation increment strength around $0.70 as the crypto’s price is ranging, positioning it to recover in the range zones.
At this point, it would be highly technical for long-position takers to stay strategically around the low trade point of $0.679 to increase their pace of percentage rate from 0.59 positive to a significantly higher value in any running term. However, the ranging motion is ongoing enough to cause temporary indecision moments if the major movers should.
MATIC/USD Market
Key Levels:
Resistance levels: $0.75, $0.80, $0.85
Support levels: $0.60, $0.55, $0.50
MATIC/USD – Daily Chart
The MATIC/USD daily reveals the crypto-economic trade is moving in ranges and positioning to recover, using the smaller indicator yardstick to formulate an entry order.
The 14-day SMA indicator is at $0.685 underneath the $0.828 point of the 50-day SMA indicator. They are still positing that falling pressures are affecting the market pattern. The Stochastic Oscillators have diverged southbound from the overbought region. But they are now trying to cross back northward between 63.86 and 70.67 levels.
Will there be further gravity-depressing pressures in the MATIC/USD trade to prevent pushes away from the smaller SMA’s point?
If severally indicated that velocity to move on to the north side reduces by the pace of the Stochastic Oscillators, leaving the formation of candlesticks around the smaller indicator, the forces to the moon will gain a higher probability to surge higher as the MATIC/USD trade is ranging, positioning to recover over the lower range line of $0.60.
There has been a path conforming more to the upward than to the downward, as even the well-defined range bounds mark points between $0.80, $0.70, and $0.60. Having observed those values, the smallest line will serve as support for the moves surging up.
Short-position placers can stay strategically between the $0.70 and $0.80 range values to see when there will be a loss or reduction of pressure to the upside to consider shorting entry. The Stochastic Oscillators have been heading toward an average degree, portending a near-end or pause session in the moves for buyers to be cautious.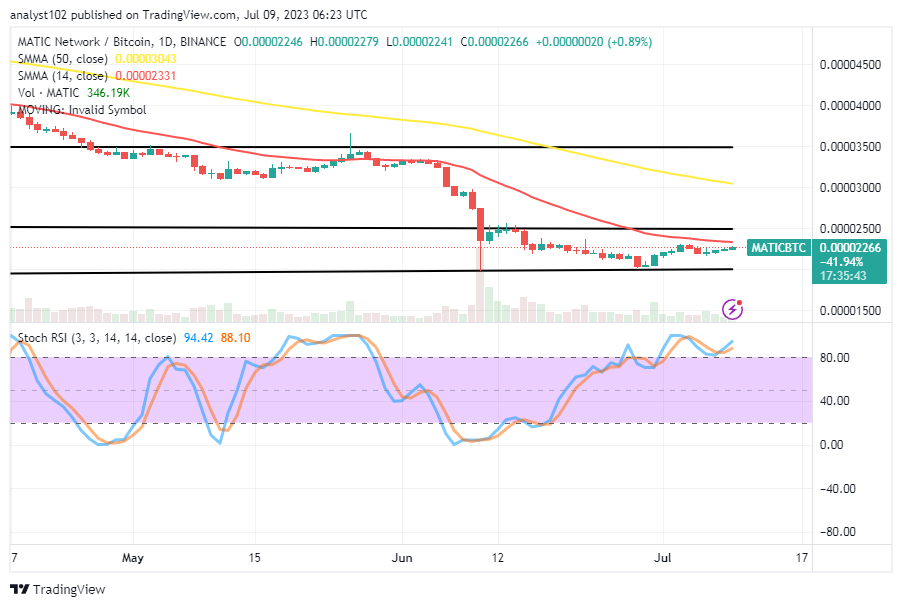
MATIC/BTC Price Analysis
In comparison, the Dogecoin market has remained moving in ranges, positioning itself to recover within well-defined range bounds.
The 14-day SMA indicator is beneath the 50-day SMA indicator to signify that downward pressures are yet to cease. At this point, some decreases are liable to play out in light of getting repositioned at lower zones not too far from the present. The Stochastic Oscillators have been able to move up into the overbought area while maintaining levels between 88.10 and 94.42. If the base crypto fails to bolster its forces, forces from the north might soon approach the pass.
Note: Cryptosignals.org is not a financial advisor. Do your research before investing your funds in any financial asset or presented product or event. We are not responsible for your investing results.
You can purchase Lucky Block here. Buy LBLOCK