Polygon (MATIC/USD) Price Is Fluctuating, Attempting a Halt
Estimated Reading Time: 3 minutes
Don’t invest unless you’re prepared to lose all the money you invest. This is a high-risk investment and you are unlikely to be protected if something goes wrong. Take 2 minutes to learn more
Polygon Price Prediction – June 25
The MATIC/USD market’s price has a fluctuation index, attempting a halt at a lower-trading spot close to the resistance line of $0.75.
There has been a depressive trade condition that has to be satisfied by bears in the crypto economy, as price is trading maximally and minimally between the $0.680 and $0.649 value points at an average percentage rate of 2.75 positive. The projection weight of seeing the downs is not expected to be that aggressive in the process of surpassing the former support zone of $0.50 in the long run.
MATIC/USD Market
Key Levels
Resistance levels: $0.75, $0.85, $0.95
Support levels: $0.50, $0.45, $0.40
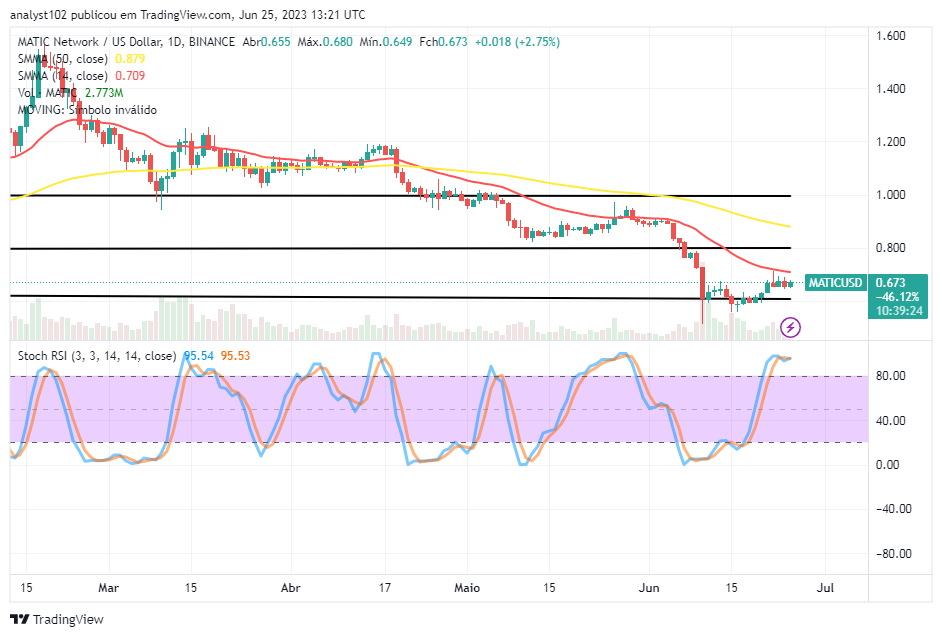
MATIC/USD – Daily Chart
It has been showcased on the MATIC/USD daily chart that the crypto’s price is fluctuating, attempting a halt between the market’s value of the smaller SMA and the support of $0.50.
The 14-day SMA trend line is at $0.709 points over the $0.879 value of the 50-day SMA trend line. And their posture-position reading signifies that the crypto economy is yet to spring out of the depressing situation imposed upon it by the purchasing weight of the US coin. The Stochastic Oscillators are in the overbought region, demonstrating levels from 95.53 to 95.54 to denote that forces to the upside could turn into a false type in the next cycle.
Technically speaking, is it best for traders to start using smaller time frames before deciding on a position in the MATIC/USD price?
It might not be too necessary for the MATIC/USD market traders to make use of the smaller time frames before deciding a position, given that the crypto-economic price is fluctuating and attempting a halt session.
Concerning the upside analytics write-up, somehow buyers would need to consolidate their presence in order to try to breach northward past the 14-day SMA indicator sustainably. However, the velocity maintained presently toward achieving that has faded off, with or without a slight sign for long-position placers to rely upon.
On the devaluation mode of the MATIC/USD market, sellers are hoping to take on the crypto economy once there is an active retracement movement from around the 14-day SMA or, better yet, from the resistance of 0.75. A cross-sectional picture between the Stochastic Oscillators in the overbought region will mean that shorting position orders will prevail consecutively to a greater extent.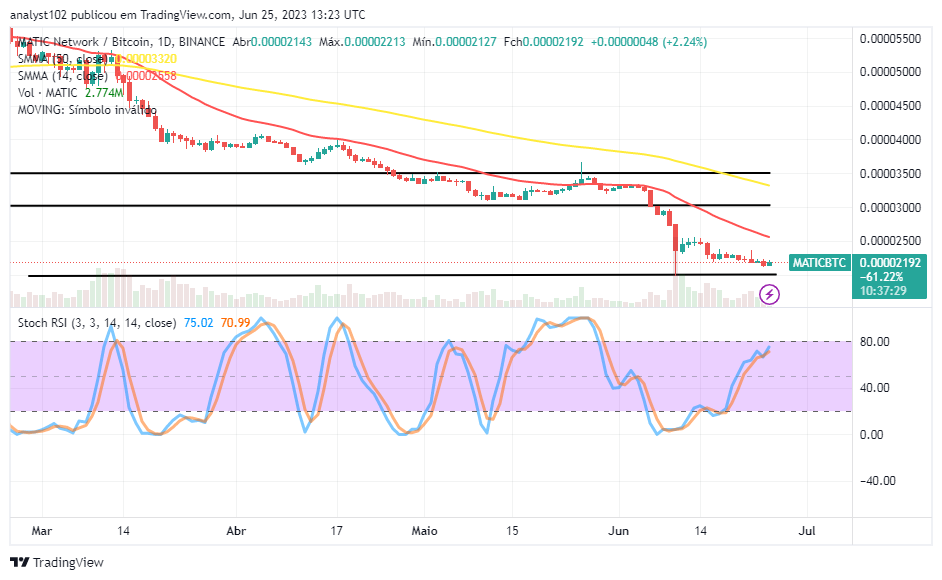
MATIC/BTC Price Analysis
In contrast, the Polygon market has been relatively trending southward against the pushing weight of Bitcoin below the trend lines of the SMAs.
The 14-day SMA indicator is underneath the 50-day SMA indicator. The Stochastic Oscillators are placed northbound after finding a stance from around the 20 before positioning at 70.99 to 75.02 points. From the look of logical reasoning, some degrees of fall might still come up in a sequential order toward the lower horizontal line drawn. Traders have to be patient until volatility returns in the pairing crypto business operation.
Note: Cryptosignals.org is not a financial advisor. Do your research before investing your funds in any financial asset or presented product or event. We are not responsible for your investing results.
You can purchase Lucky Block here. Buy LBLOCK