Chainlink Retreats as It Returns to Its Prior High of $22
Estimated Reading Time: 2 minutes
Don’t invest unless you’re prepared to lose all the money you invest. This is a high-risk investment and you are unlikely to be protected if something goes wrong. Take 2 minutes to learn more

Chainlink (LINK) Long-Term Analysis: Bullish
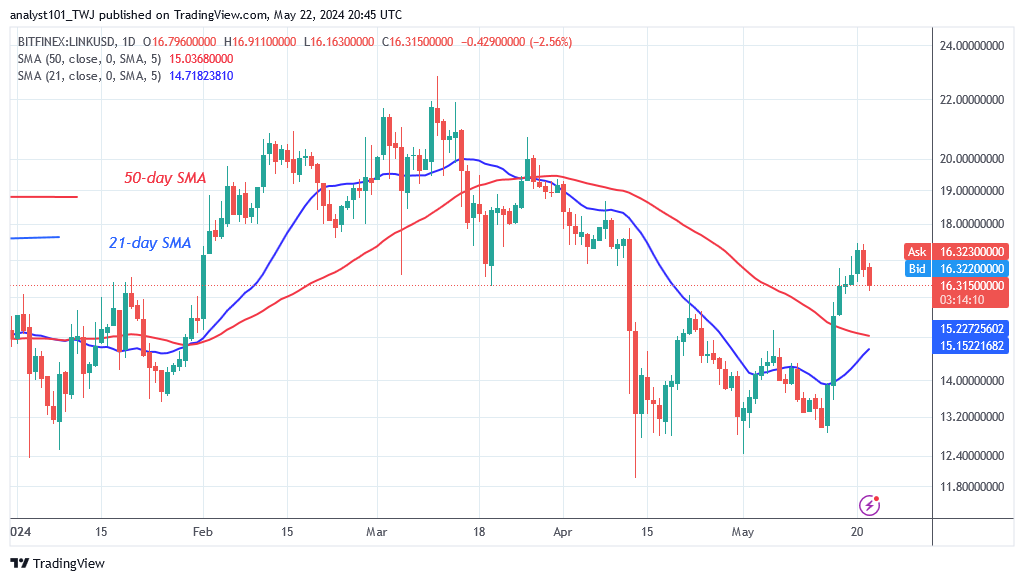
Chainlink’s (LINK) price is retracing within the positive trend zone as it returns to its prior high of $22. On the May 20 rise, LINK price broke above the moving average lines, rallying to a high of $17.50 before being repulsed. The cryptocurrency is currently retreating as it approaches the breakout level of $16.53 or the 50-day SMA. The current rise will resume if the altcoin retraces and gains support above the 50-day SMA.
On the upside, if the altcoin rises and breaches the barrier above $17.50, the market will return to its prior highs between $20 and $22. Meanwhile, the altcoin is trading at $16.36, just above the 50-day SMA.
Technical indicators:
Major Resistance Levels – $20.00, $22.00, $24.00
Major Support Levels – $12.00, $10.00, $8.00
Chainlink (LINK) Indicator Analysis
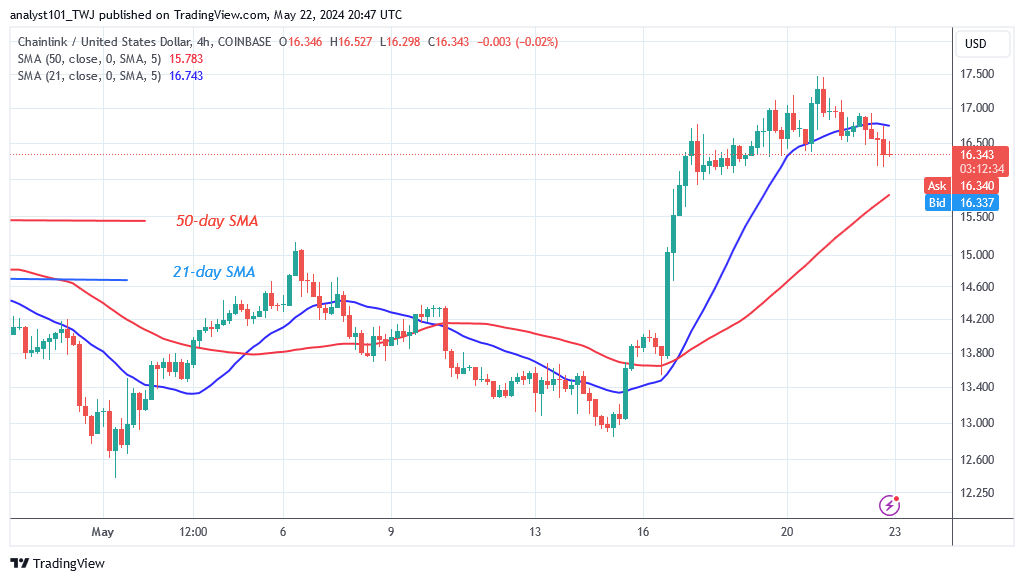
Chainlink will rise since the price bars remain above the moving average lines. On the 4-hour chart, the cryptocurrency price is expected to fluctuate as it falls between the moving average lines. The altcoin is expected to retrace further above $15.00 or the 50-day SMA.
What Is the Next Direction for Chainlink (LINK)?
Chainlink’s price has resumed a positive trend as it returns to its prior high of $22. On the upside, buyers plan to push the altcoin above its prior highs of $20 and $22. Meanwhile, the crypto signal will remain favorable as long as the price bars are above the moving average lines.
You can purchase Lucky Block here. Buy LBLOCK
Note: Cryptosignals.org is not a financial advisor. Do your research before investing your funds in any financial asset or presented product or event. We are not responsible for your investing result