Pump.fun Price Prediction: Bears Extend Dominance
Estimated Reading Time: 3 minutes
Don’t invest unless you’re prepared to lose all the money you invest. This is a high-risk investment and you are unlikely to be protected if something goes wrong. Take 2 minutes to learn more

Pump.fun price has dropped 5.19% to $0.00186 over the last 24 hours. The market has been underperforming in a broadly declining market. As it stands, this bearish price action is primarily driven by a sector-wide rotation as investors shift capital away from high-beta, riskier altcoins during periods of intensified market stress.
Meanwhile, this downturn is further increased by a Bitcoin-led decline and extreme fear sentiment, amplifying local selling pressure. To this end, the token eyes support near $0.0018; a failure to stabilize at this level could trigger a deeper correction toward the $0.0015 level.
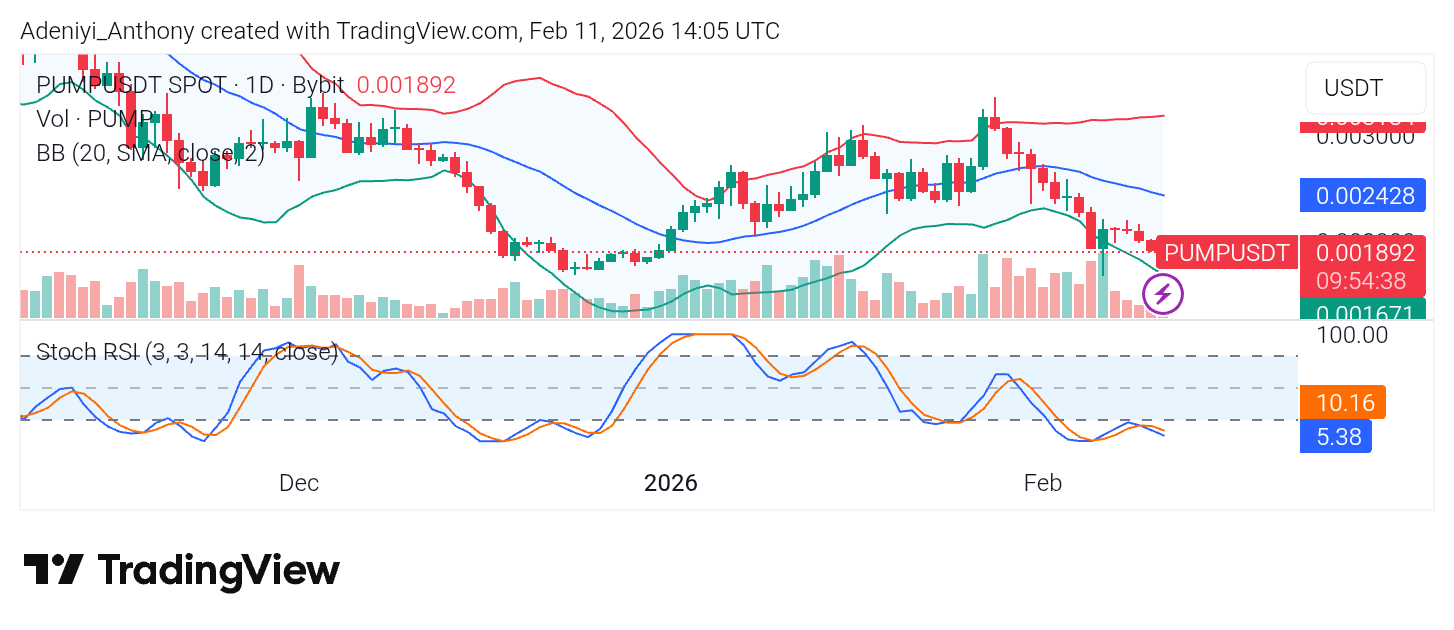
Currently, Pump.fun trades at $0.001892, with over 853 million traded volumes on the daily timeframe.
Technical Indicators
Major Resistance Levels: $0.002130, $0.002428, and $0.003100
Major Support Levels: $0.001850, $0.001670, and $0.001230
Technical Analysis
Currently, the overall structure of the Pump.fun against Tether shows a bearish reversal following a peak in late January. At the moment, the price is in a clear short-term downtrend, characterized by lower highs and lower lows over the recent days. Right now, the price is riding the lower Bollinger Band, which typically indicates strong downward momentum.
Additionally, the SRSI beneath the chart appears to be confirming the oversold condition as the lines now operate deep around the 10-mark level. However, this may suggest a relief bounce in the near term, but the price needs to stabilize for such to happen, as the bands expand to signal an extended downtrend.
To this end, without a clear signal from the SRSI and a move above the middle Bollinger limit around $0.002428.
PUMP/USDT Analysis: What’s Next?
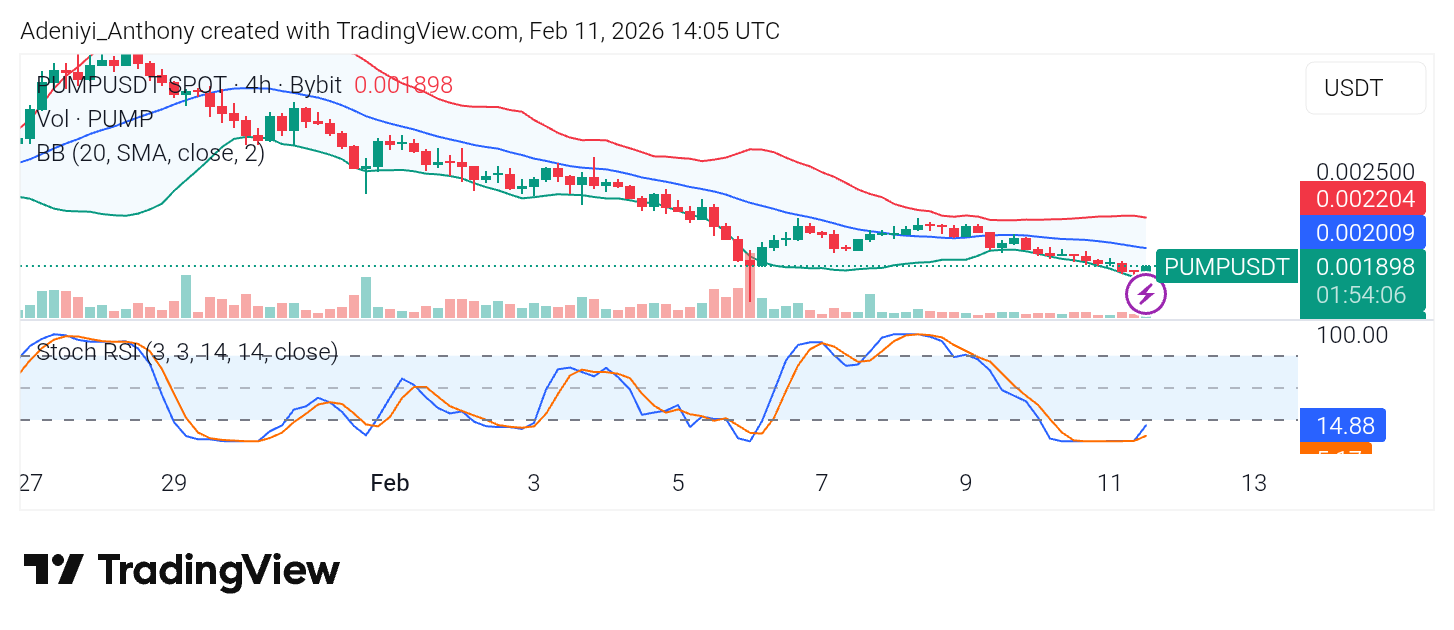
The PUMP/USDT on the 4-hour chart shows a persistent bearish trend, with price action consistently making lower highs and lower lows, which is not different from the daily chart. As it stands, the bands are narrowing, indicating a decrease in volatility, while the price hugs the lower band, signaling of strong downward pressure.
However, at the bottom, the Stochastic RSI is currently in the oversold zone. A bullish crossover is beginning to form, suggesting a potential short-term relief bounce or consolidation. However, without a significant spike in volume or a break above the blue midline ($0.002009), the overall bias remains firmly bearish.
You can purchase crypto coins here. Buy Crypto