SPONGE/USD ($SPONGE) at a Crossroads: Bearish Exhaustion Meets Bullish Ambition at Key Support
Estimated Reading Time: 2 minutes
Don’t invest unless you’re prepared to lose all the money you invest. This is a high-risk investment and you are unlikely to be protected if something goes wrong. Take 2 minutes to learn more

The $SPONGE market stands at a decisive turning point as a fierce tug-of-war unfolds between bulls and bears around the critical $0.000013 support level. This prolonged standoff is illustrated by a sequence of Doji candlesticks, signaling indecision and market equilibrium. Historically, such formations following a sharp decline often hint at potential bullish reversals.
Key Price Levels
- Resistance: $0.000115, $0.000120, $0.000130
- Support: $0.000010, $0.000009, $0.000008
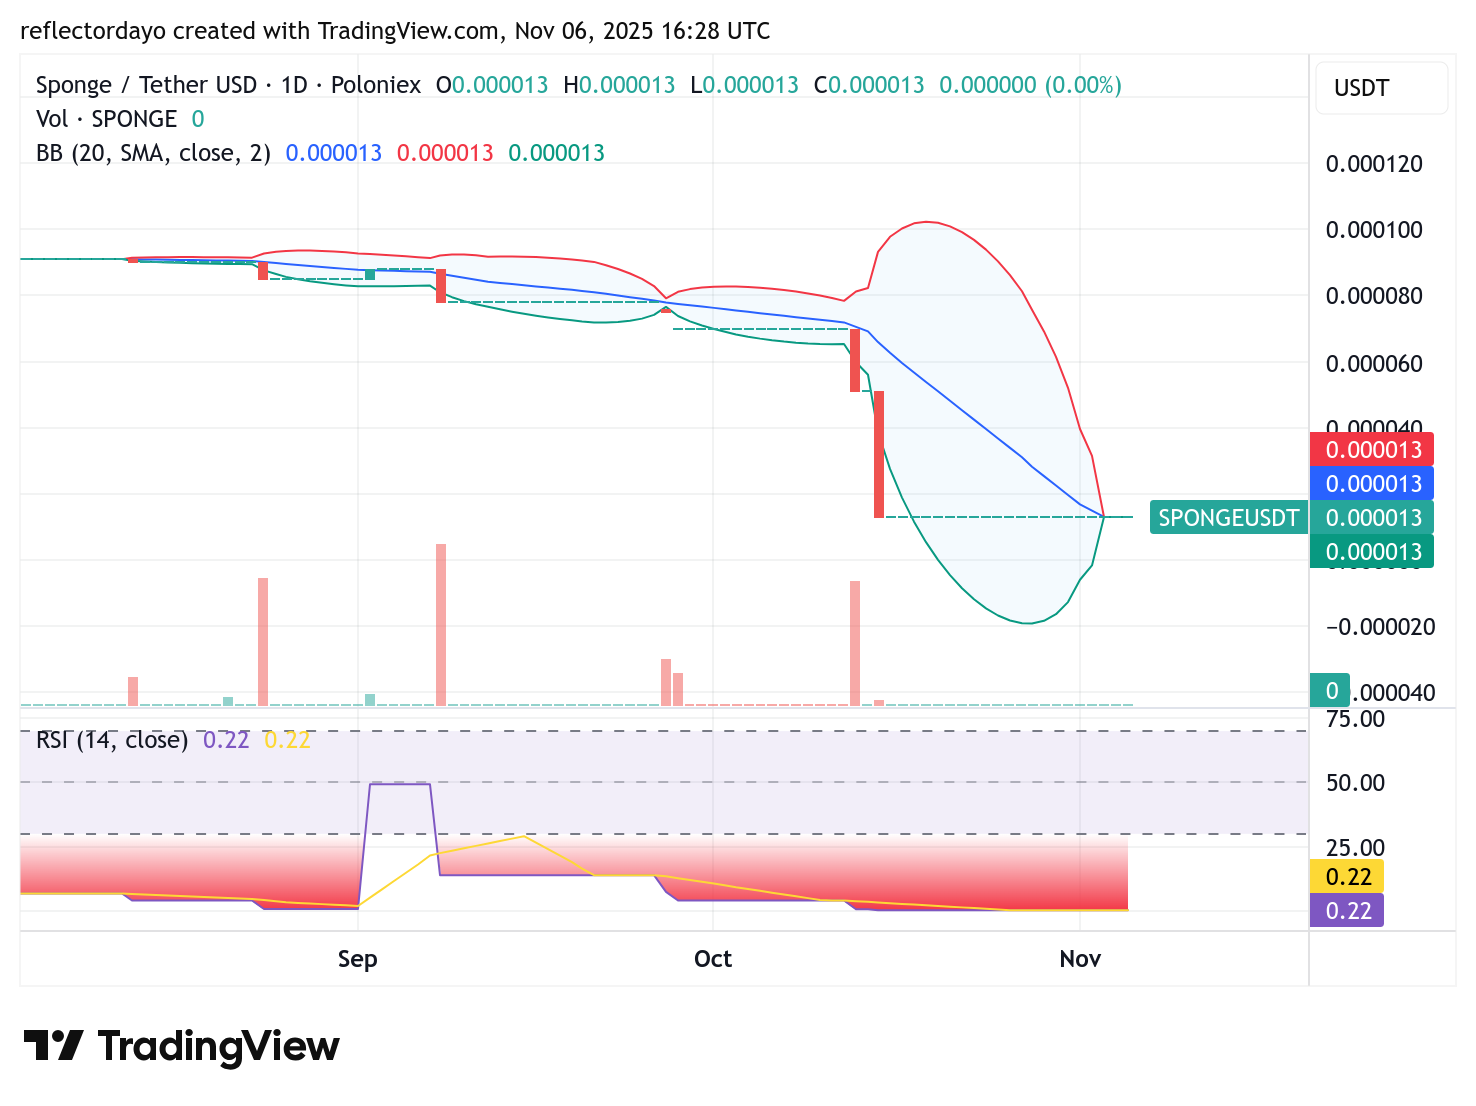
$SPONGE Daily Chart: Reversal Signals Strengthening
The broader technical outlook suggests growing evidence of a possible trend reversal. The asset is currently trading below the lower Bollinger Band, while the Relative Strength Index (RSI) remains deep in oversold territory. This combination signals that selling momentum may be waning, and the risk-to-reward ratio is increasingly tilting in favor of the $SPONGE buyers.
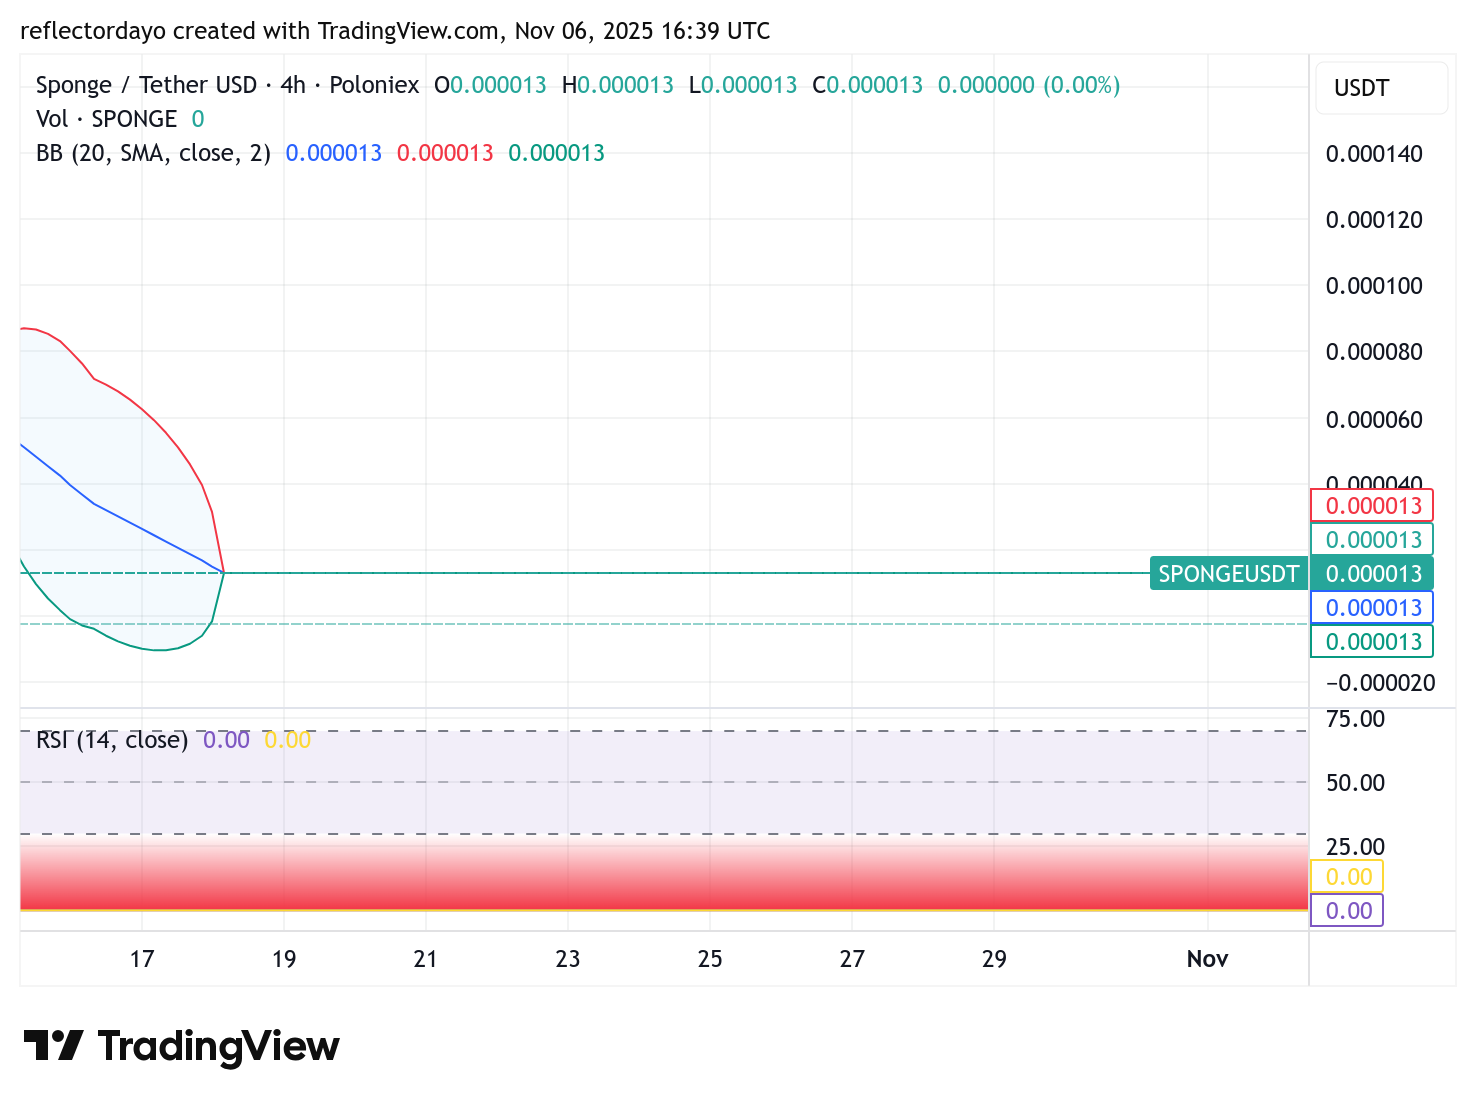
SPONGE/USD 4-Hour Chart: Watching for Breakout Momentum
On the 4-hour chart, $SPONGE appears to be gathering momentum for its next decisive move. The immediate bullish target lies near the $0.00006 resistance level. Given the extended consolidation and compressed volatility, any breakout from the current range could trigger a sharp and rapid price movement. Traders should closely watch this zone, as the outcome will likely define the short-term trajectory of the market.
Buy SPONGE/USD
we back pic.twitter.com/660xZnULh9
— $SPONGE (@spongeoneth) November 4, 2025
Join the SPONGE community and get in on the next big crypto opportunity! Buy Sponge ($SPONGE) today