Litecoin (LTC) Price Prediction: LTC/USDT Market Slightly Elevated
Estimated Reading Time: 3 minutes
Don’t invest unless you’re prepared to lose all the money you invest. This is a high-risk investment and you are unlikely to be protected if something goes wrong. Take 2 minutes to learn more

Date: September 9, 2025
The Litecoin market has climbed further above the $110 price level. At present, the token trades slightly above this point. Trend analysis indicates that price action remains on a generally upward trajectory. More details about this market are provided below.
Key Price Levels
Resistance: $115, $120, $125
Support: $110, $105, $100
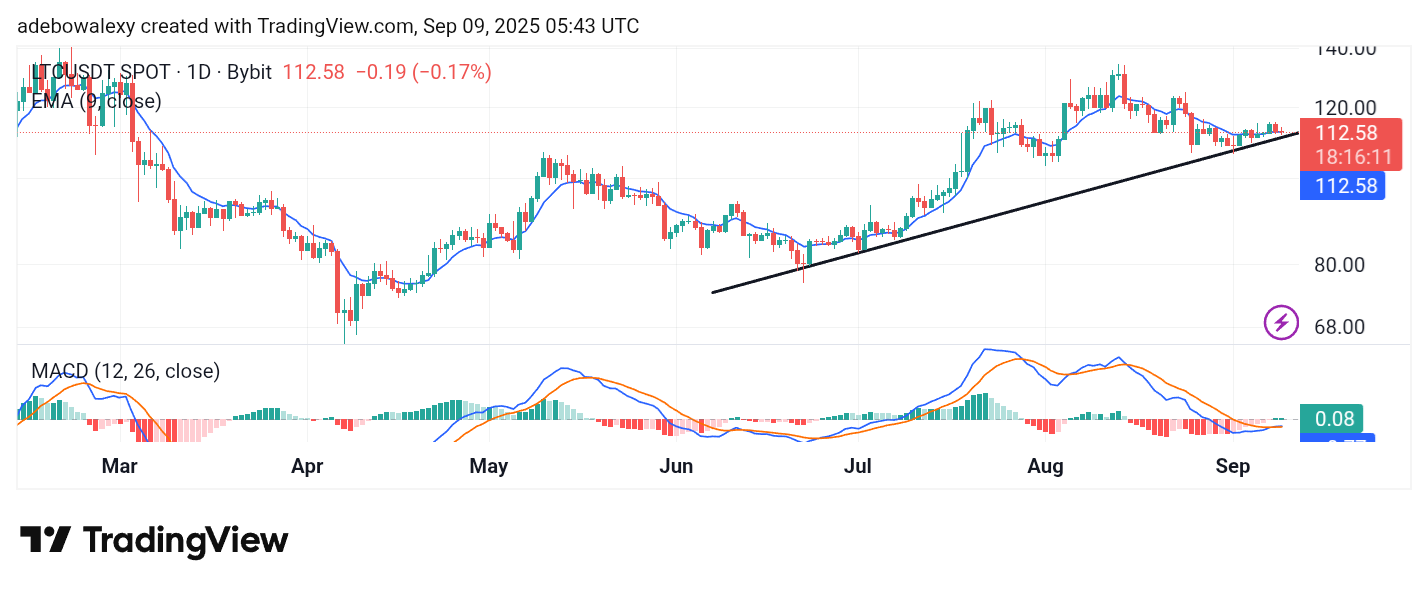
The Litecoin market has recently pulled back below the 9-day Exponential Moving Average (EMA) line since the last price candle appeared on the chart. However, the mentioned price candle is thin and aligns with the EMA curve at $112.58. At the same time, this keeps price activity above the upward-sloping trendline. Meanwhile, the Moving Average Convergence Divergence (MACD) indicator has delivered a crossover below the equilibrium level, but the lines that follow are proceeding sideways.
Litecoin (LTC) Price Prediction: LTC/USDT Tightens Further
Based on market indications on the Litecoin daily chart, it is clear that price action currently lacks a decisive direction. The latest price candle suggests conflicting market sentiment. Meanwhile, the MACD indicator, after forming a crossover below the equilibrium level, does not signal any imminent strong price move.
Its lines appear merged and are moving sideways, while the histogram bars are struggling to climb above the equilibrium level. This shows that upside momentum remains subdued and may not trigger significant price movement in the short term.
Litecoin (LTC) Price Prediction: LTC/USDT Oscillates Around the 9-day EMA (4-Hour Chart)
On the 4-hour chart, price action is consolidating around the 9-day EMA line. Here, the market has descended below the EMA curve but continues to test it from beneath.
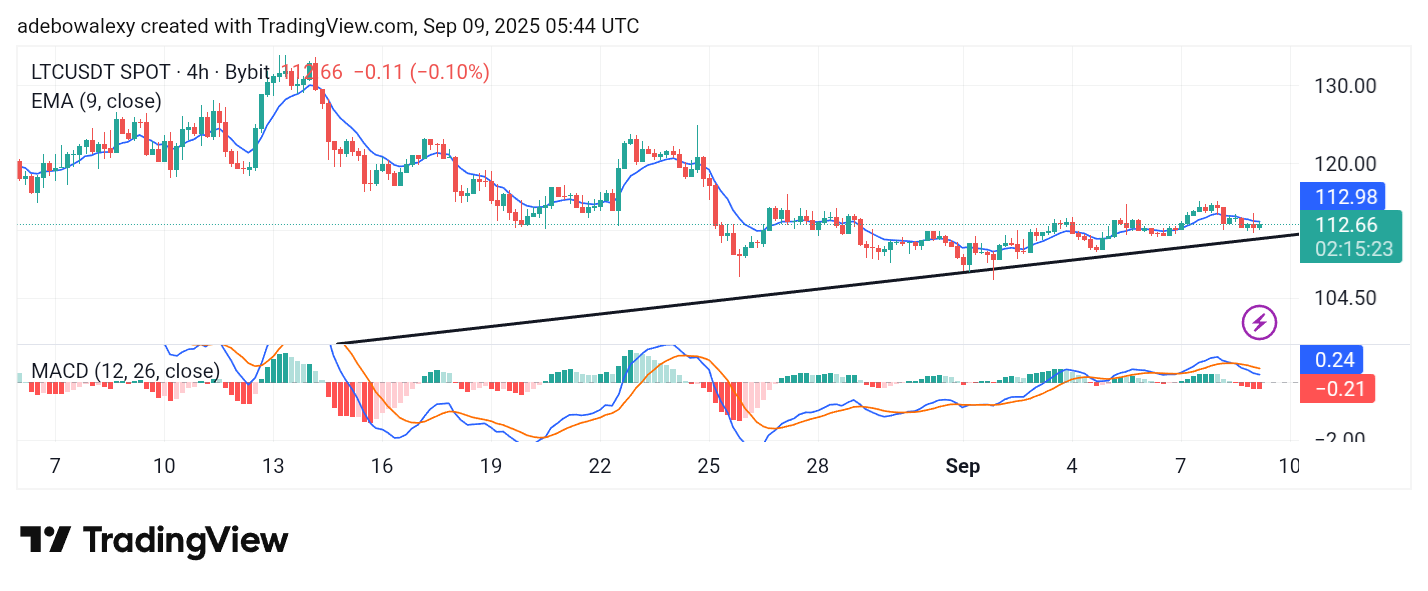
The ongoing session has appeared as a green candle, though price activity remains positioned above the upward-sloping trendline drawn on the chart. Technically, this still indicates that the long-term upside trend is intact.
Meanwhile, the MACD curves are above the equilibrium level but have delivered a downward crossover, with their bars appearing red and positioned below the equilibrium line. As it stands, the short-term outlook for this market is not particularly bright, though traders may still target the $115.00 resistance level.