Litecoin (LTC) Price Prediction: LTC/USDT Appears Vulnerable
Estimated Reading Time: 3 minutes
Don’t invest unless you’re prepared to lose all the money you invest. This is a high-risk investment and you are unlikely to be protected if something goes wrong. Take 2 minutes to learn more

Date: September 2, 2025
The Litecoin market has generally been hovering just above the $110 price level over the past week. From the look of things, it appears that the mentioned price level is providing sizeable support against downward pressure. Let’s take a more detailed look at the market below.
Key Price Levels
Resistance: $115, $120, $125
Support: $110, $105, $100
Price action seems to have found a base around the $110 price level. The latest price candle on the chart has rebounded off the upward-sloping trend line, which keeps the integrity of the market’s general trend intact. However, price action lies below the middle limit of the Bollinger Bands (BB) indicator. The applied Stochastic Relative Strength Index (SRSI) indicator lines are in the oversold region but have converged for an upward crossover within that area.
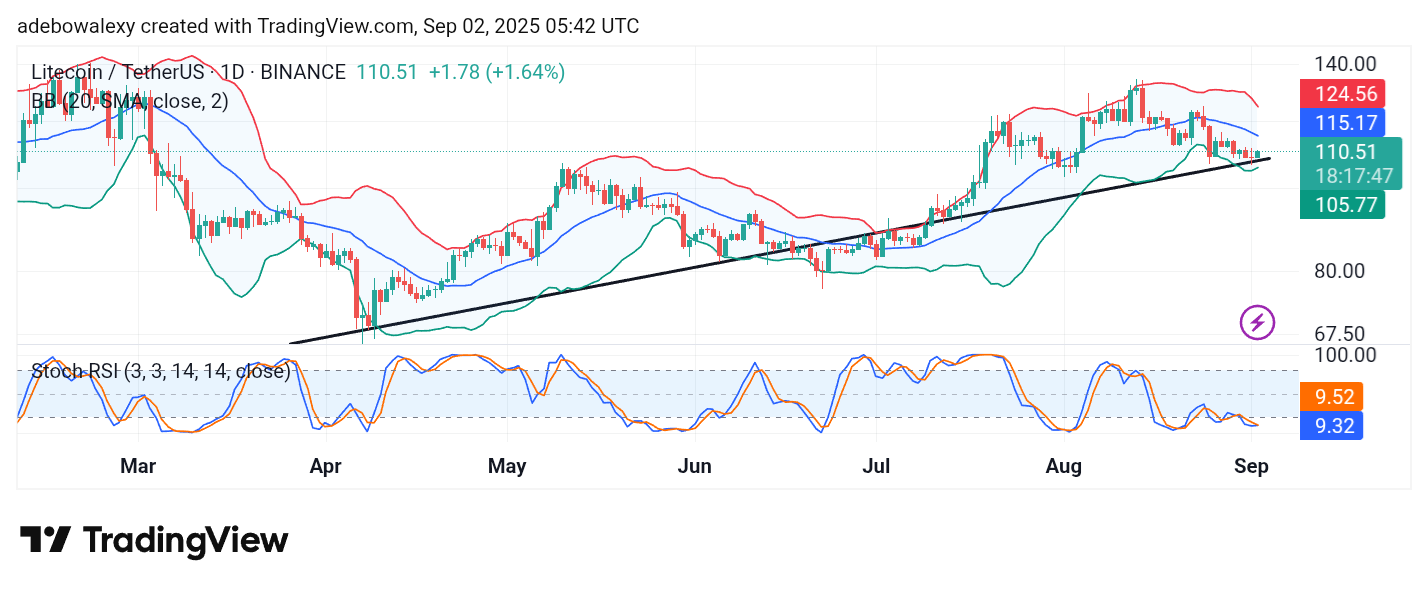
Litecoin (LTC) Price Prediction: LTC/USDT Posts Only Modest Gains Below Key Levels
Price activity in the Litecoin daily chart has been moving mostly sideways. Meanwhile, price action recently touched the upward-sloping trend line in the previous session, resulting in a modest upward rebound in the ongoing session.
Nevertheless, price movement remains below the middle band of the BB indicator. Price candles are also relatively small, whether red or green, indicating that investors may lack strong interest in the market. However, the SRSI lines are converging and show an upward crossover in the oversold region.
Litecoin (LTC) Price Prediction: LTC/USDT Pips Through a Key Level (4-Hour Chart)
On shorter time frames, the Litecoin market shows that price action may have poked through a key technical level.
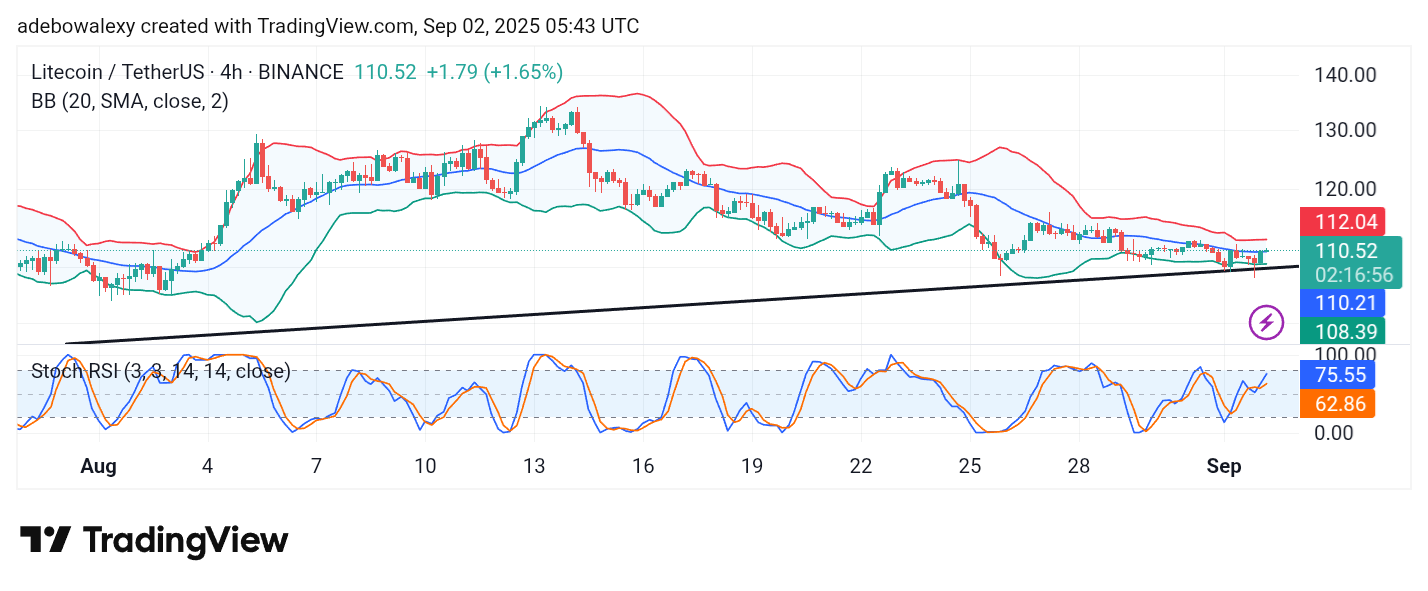
The current session on the token’s 4-hour chart has its base above the mid-band of the BB indicator. Although the candle has a tiny body due to compression, it sits at a critical level.
The lines of the SRSI indicator are maintaining an upward trajectory following a bullish crossover above the 50 level of the indicator. Therefore, while an upward trajectory seems set, it appears that only minimal gains may be available in this market toward the $111.50 price level.