Litecoin (LTC) Price Prediction: LTC/USDT Maintains the $110 Baseline
Estimated Reading Time: 2 minutes
Don’t invest unless you’re prepared to lose all the money you invest. This is a high-risk investment and you are unlikely to be protected if something goes wrong. Take 2 minutes to learn more
Date: August 26, 2025
With Bitcoin nosediving, most altcoins are following the same trend. The Litecoin market is no exception, as it has moved toward the $110 baseline. Even from a technical perspective, the situation does not appear overly optimistic for this coin.
Key Price Levels
Resistance: $115, $120, $125
Support: $110, $105, $100
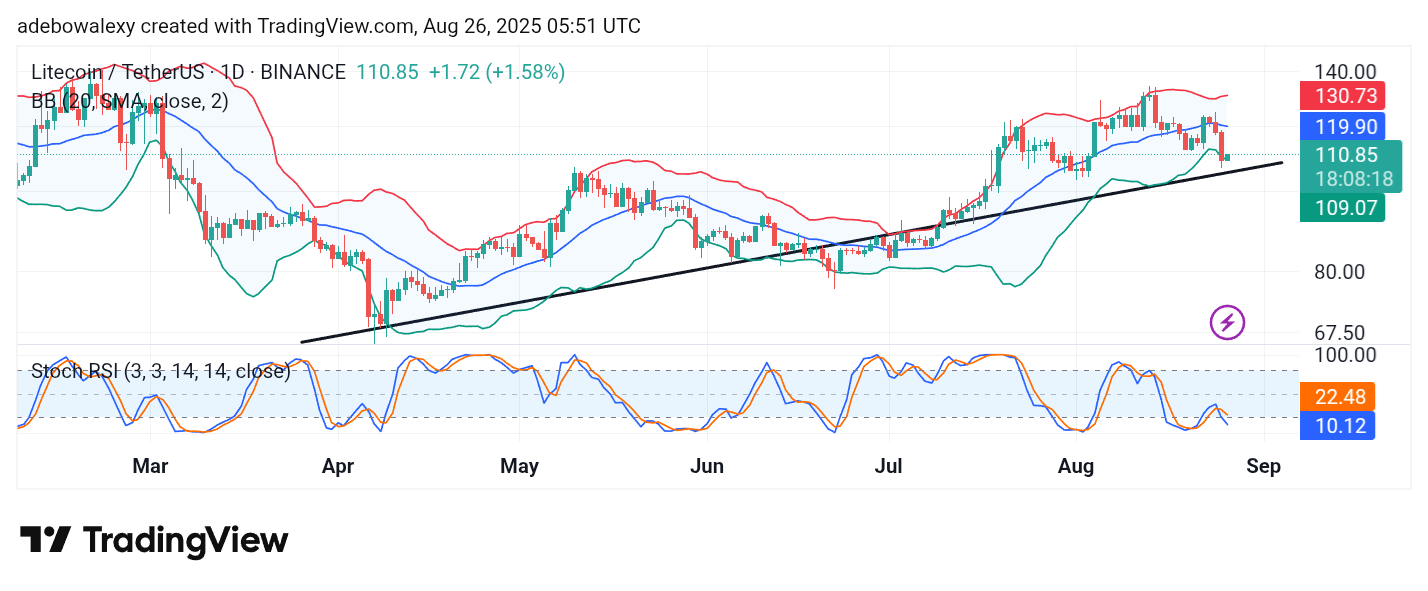
The Litecoin market still reflects a bearish outlook. Although the ongoing session is bullish and represented by a green price candle, the candle bears an upper shadow while positioned close to the lower band of the Bollinger Bands (BB) indicator. Furthermore, the lines of the Stochastic Relative Strength Index (SRSI) are situated deep in the oversold region and appear to lack momentum for a decisive crossover.
Litecoin (LTC) Price Prediction: LTC/USDT Bears Keep the Pressure On
With Litecoin’s price action trending below the middle band of the BB indicator, bearish dominance remains apparent. The ongoing session is marked by a small green price candle that already shows weakness against downward forces, highlighted by the presence of an upper shadow.
Likewise, the SRSI lines continue to signal bearish momentum, suggesting that sellers remain in control. This perspective is reinforced by the fact that the indicator has recently delivered another bearish crossover within the oversold region.
Litecoin (LTC) Price Prediction: LTC/USDT Modest Gains Are Vulnerable (4-Hour Chart)
Examining the Litecoin 4-hour chart shows that price action has been retracing slightly upward, but the movement remains limited. The observed gains are relatively small and remain below significant technical benchmarks, pointing to potential vulnerability.
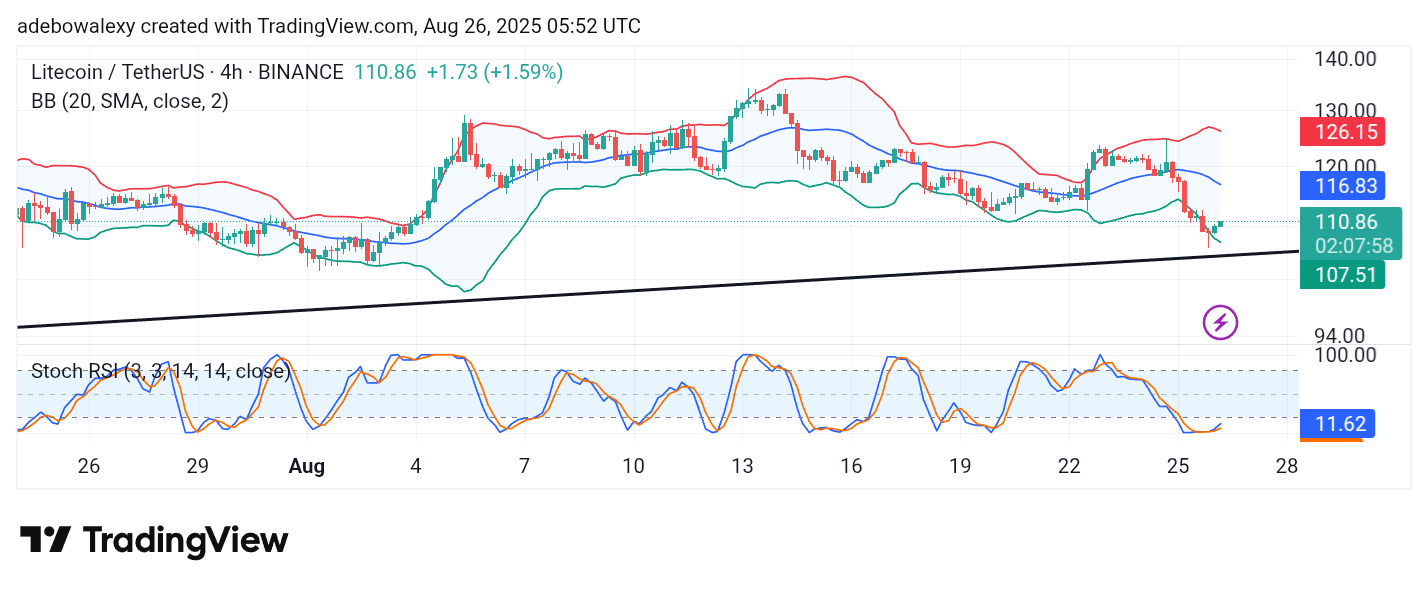
The last two candles on this chart are green but display very small bodies, indicating only marginal steps above the lower band of the BB indicator. Meanwhile, the SRSI lines are gradually adopting an upward slope from the oversold territory. As a result, traders considering bullish positions should remain cautious, as potential gains may be modest and likely capped just beneath the $115 price level.