Litecoin (LTC) Price Prediction: LTC/USDT Edges Lower
Estimated Reading Time: 2 minutes
Don’t invest unless you’re prepared to lose all the money you invest. This is a high-risk investment and you are unlikely to be protected if something goes wrong. Take 2 minutes to learn more
Date: August 19, 2025
The Litecoin market has continued to edge lower following the latest pullback from around the \$130 price level. The market now appears to have breached a key support level. However, bearish progress remains dependent on the overall market sentiment.
Key Price Levels:
Resistance: $120, $125, $130
Support: $115, $110, $105
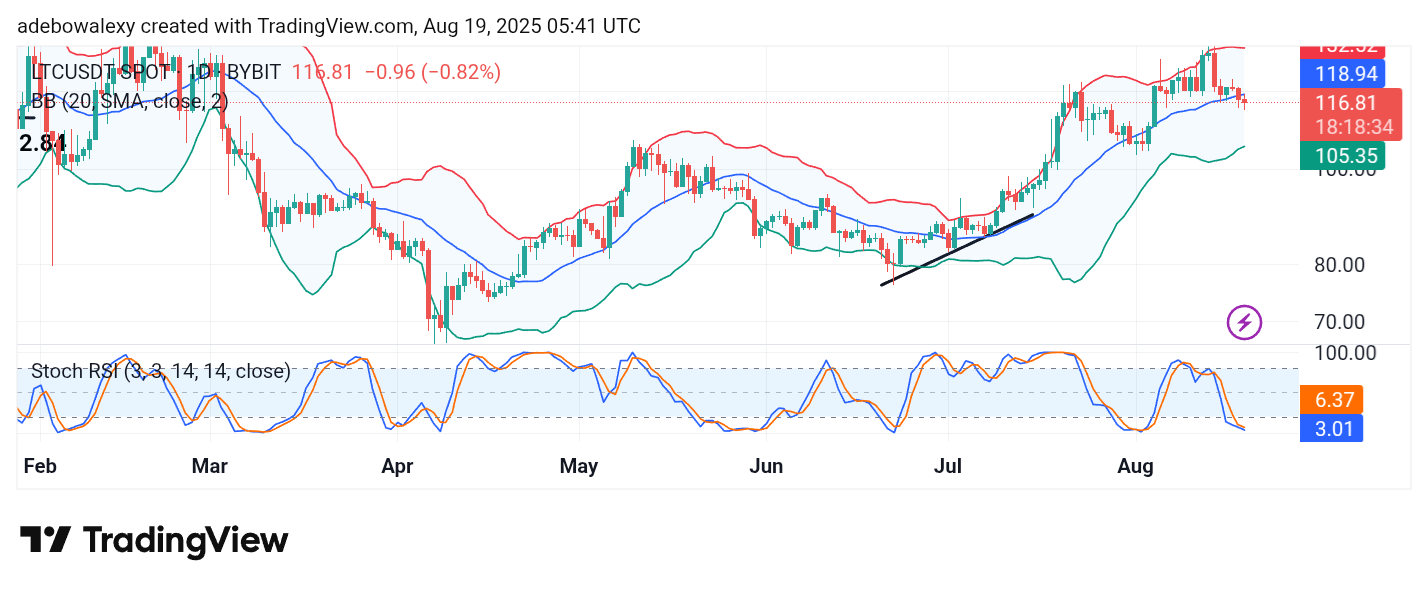
The last price candle on the Litecoin daily chart formed a red hammer-like pattern. Although this candle has brought trading below the middle band of the Bollinger Bands (BB) indicator, the BB still retains a slight upward slope. Meanwhile, the Stochastic Relative Strength Index (SRSI) lines are trending lower despite the earlier convergence that took place.
Litecoin (LTC) Price Prediction: LTC/USDT Stays in Cruise Control
The Litecoin market remains under bearish suppression, as seen from activities on the daily chart. The most recent price candle has pushed trading below the middle band of the BB indicator.
This development suggests that the market may have confirmed a bearish phase. Likewise, the lines of the SRSI indicator have fallen deep into the oversold region, where they remain merged. The merged lines continue to trend downward, signaling that bearish forces are still in control of market momentum.
Litecoin (LTC) Price Prediction: LTC/USDT Sees a Bounce but Remains Suppressed (4-Hour Chart).
On the shorter 4-hour timeframe, the Litecoin market has reached a baseline, triggering an upward rebound. This is visible through the green formation of the most recent price candle on the chart. Nevertheless, trading activity still remains below the middle band of the BB indicator.
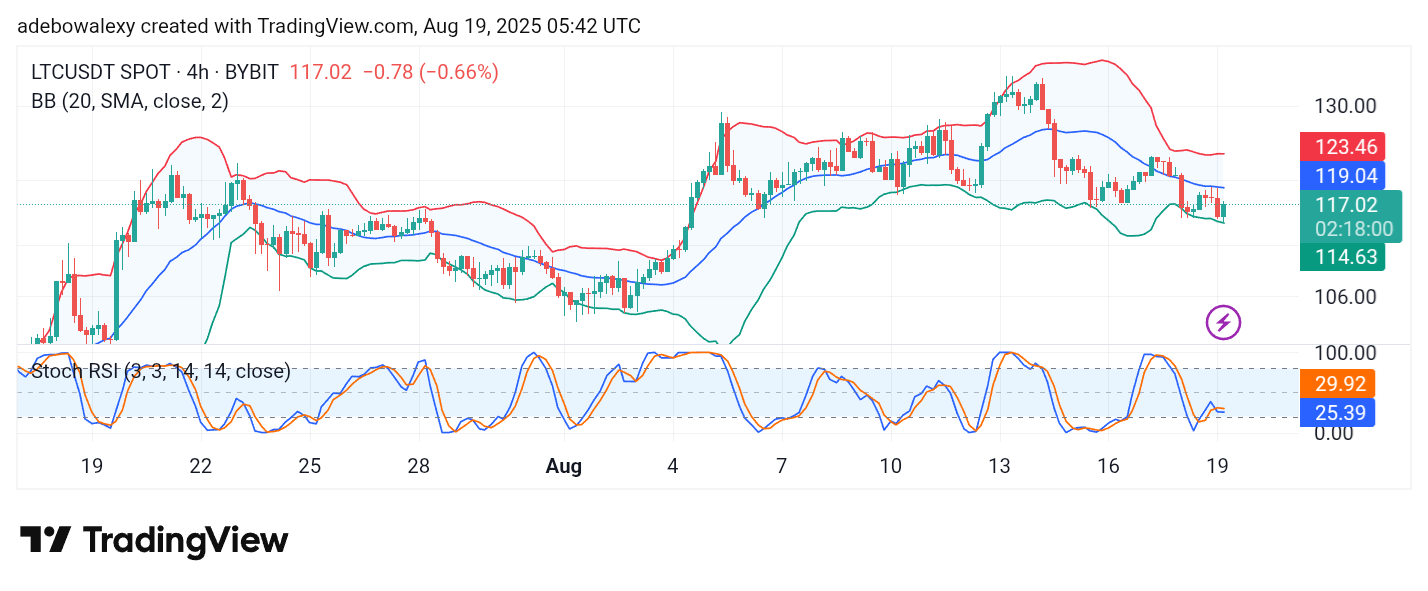
Despite the SRSI showing an upside crossover, its emerging lines are now moving sideways, reflecting weak bullish momentum. Similarly, the BB indicator continues to maintain a slight downward slope. As things stand, the market may still retest the $115 support level if current conditions remain unchanged.