Litecoin (LTC) Price Prediction: LTC/USDT Sees a Pullback
Estimated Reading Time: 2 minutes
Don’t invest unless you’re prepared to lose all the money you invest. This is a high-risk investment and you are unlikely to be protected if something goes wrong. Take 2 minutes to learn more

Date: August 12, 2025
Price movement in the Litecoin market has recently tested higher price levels, such as $128. Nevertheless, the market has experienced a notable pullback but still holds long-term potential.
LTC/USDT Long-Term Trend: Bullish (Daily Chart)
Key Price Levels:
Resistance: $120, $125, $130
Support: $115, $110, $105
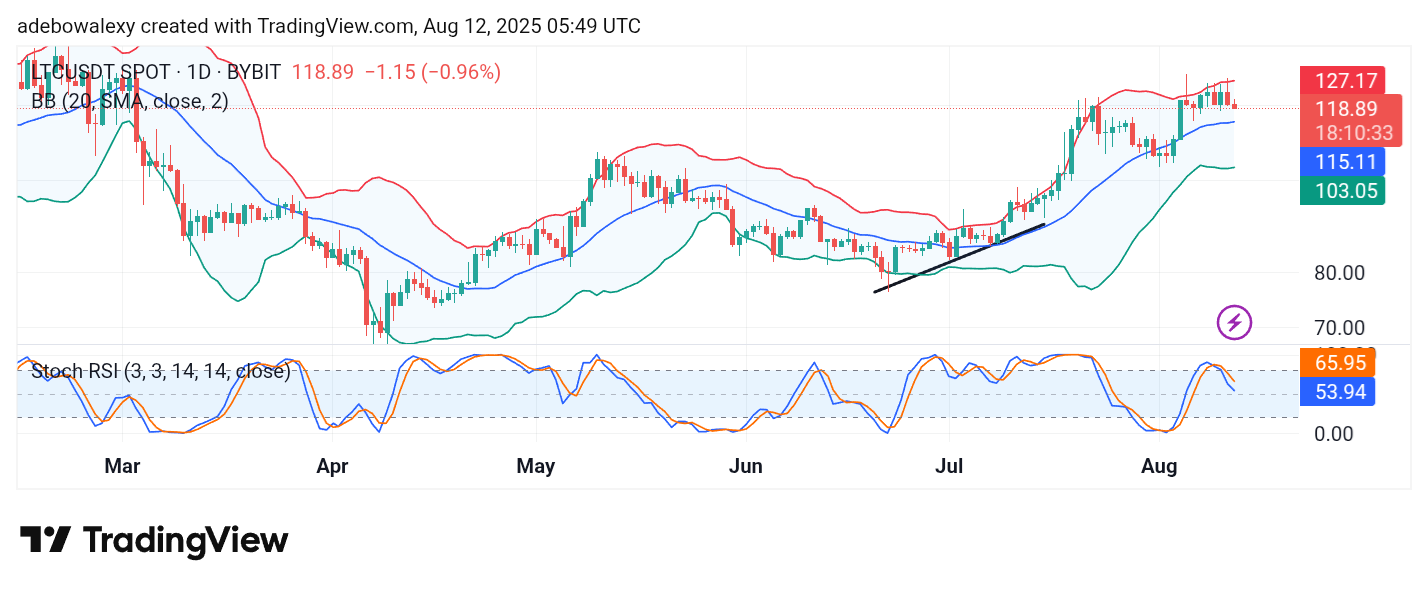
The Litecoin market has witnessed a downward retracement over recent sessions. This started in the previous session when price action hit the uppermost band of the Bollinger Bands (BB) indicator. The ongoing session has also appeared bearish, aligning with the downward trend from the previous session. Meanwhile, the BB indicator remains sideways as price action stays above the middle band. The Stochastic Relative Strength Index (SRSI) is falling toward the 50 threshold level.
Litecoin (LTC) Price Prediction: LTC/USDT Could Descend Towards $115
While downward forces remain prominent in the Litecoin daily chart, technical indications suggest further decline is possible. The last price candle resembles an inverted hammer but remains above the middle band of the BB indicator.
As a result, the BB indicator still trends sideways. The SRSI lines are falling toward the oversold region, signaling that bearish forces are still in control. Consequently, the market may head further downward.
Litecoin (LTC) Price Prediction: LTC/USDT Downward Retracement Slows (4-Hour Chart)
In the Litecoin 4-hour price chart, price action shows an extended downward retracement. Red price candles have appeared consistently since the market touched the uppermost BB band, moving through the middle band and now testing the lowest band.
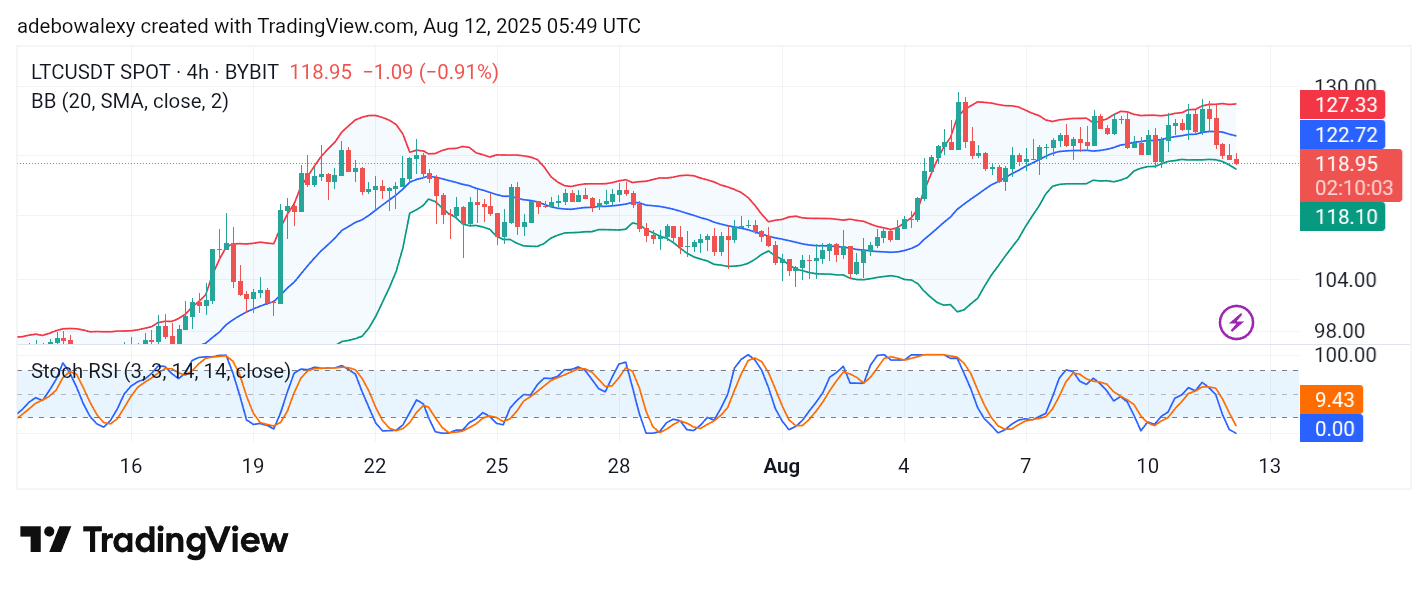
However, the last three price candles have been much smaller, suggesting that bearish momentum may be weakening. Meanwhile, the SRSI line is testing the lowest level of the oversold region.
This indicates the possibility of an upward rebound soon, even if there is a modest extension of bearish activity. Consequently, traders can anticipate an upward bounce above the $115 price level.