Litecoin (LTC) Price Prediction: LTC/USDT Bull Run Hits a Brick Wall
Estimated Reading Time: 2 minutes
Don’t invest unless you’re prepared to lose all the money you invest. This is a high-risk investment and you are unlikely to be protected if something goes wrong. Take 2 minutes to learn more

Date: August 5, 2025
Recent price movement in the Litecoin market suggests that investor interest is increasing. This is evident in the significant surge seen in price action recently. As such, it becomes essential to examine the market for potential trading opportunities.
LTC/USDT Long-Term Trend: Bullish (Daily Chart)
Key Price Levels:
Resistance: $125, $130, $135
Support: $120, $115, $110
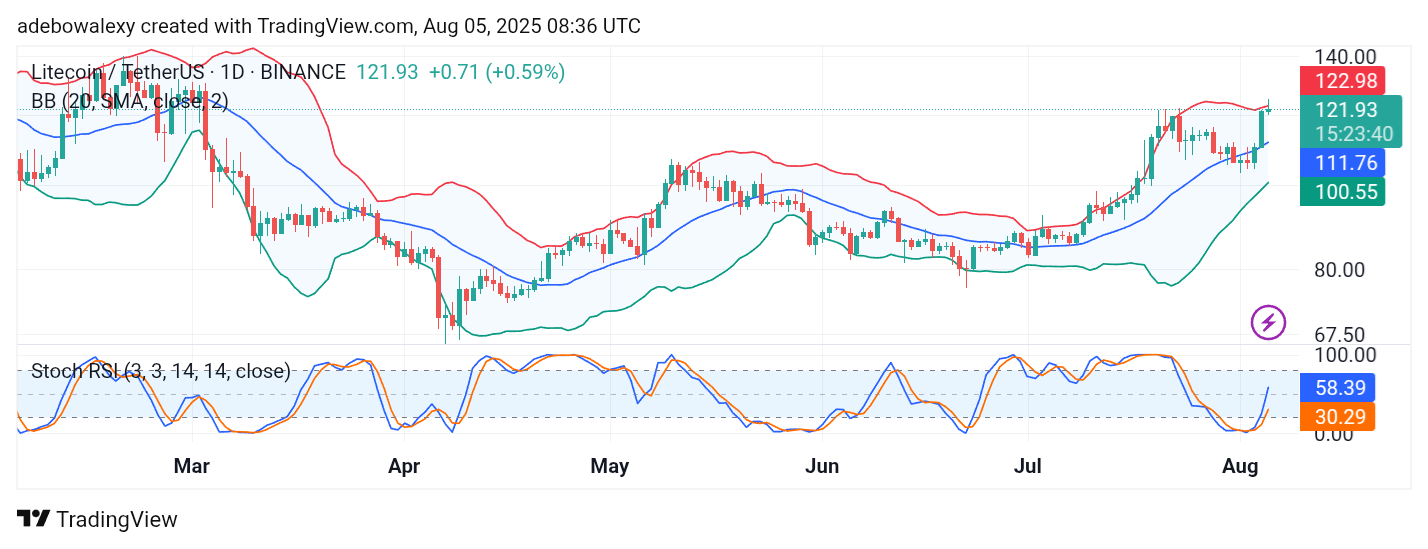
In the ongoing session, the Litecoin daily chart shows price action occurring just above the \$120 level. This has kept the market closely aligned with the upper band of the Bollinger Bands (BB) indicator. The BB indicator is beginning to contract slightly but maintains a strong upward slope.
Similarly, the Stochastic Relative Strength Index (SRSI) lines are also rising steeply from the oversold region, reinforcing the notion that bullish momentum remains intact.
LTC/USDT Bulls Face a Challenge
Price movement on the Litecoin daily chart suggests that bullish momentum is now facing resistance near a key ceiling. The latest price candle stands above the psychological support at $120 but shows a significant downward wick, leaving behind a candle pattern resembling an inverted hammer. This is often interpreted as a potential trend reversal signal, suggesting a possible short-term pullback.
Nevertheless, price action remains well above the middle band of the BB indicator, and the trajectory of the SRSI line indicates that bullish forces are still dominant.
LTC/USDT Hovers, But Retains Strong Prospects (4-Hour Chart)
On the 4-hour chart, it’s evident that bullish pressure is still in play. Price action recently tested the uppermost band of the BB indicator, then gently retreated just below it. The latest candle remains green, signaling that buyers are still active.
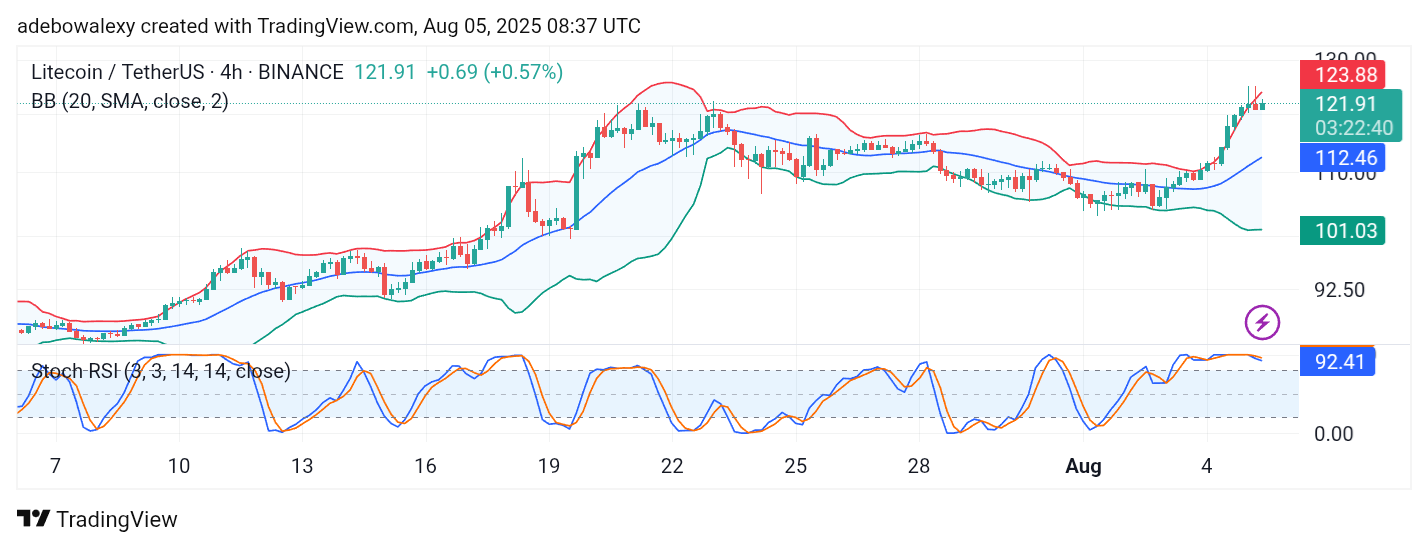
However, the SRSI line has hovered around the 100 level for a while and now shows a slight downward turn at the end—another possible sign of an incoming pullback. Even so, the market still appears to be eyeing a potential breakout above the $125 resistance level.