Dogecoin (DOGE) Price Prediction: DOGE/USDT Makes a Modest Recovery
Estimated Reading Time: 3 minutes
Don’t invest unless you’re prepared to lose all the money you invest. This is a high-risk investment and you are unlikely to be protected if something goes wrong. Take 2 minutes to learn more

Date: August 4, 2025
The Dogecoin market recently experienced a strong downward correction, bringing the token to trade below the $0.2000 price mark. Based on the current market trajectory, it appears to be on a recovery path—though it remains highly vulnerable for now.
DOGE/USDT Long-Term Trend — Bullish (Daily Chart)
Key Price Levels:
Resistance: $0.2000, $0.2500, $0.3000
Support: $0.1900, $0.1700, $0.1500
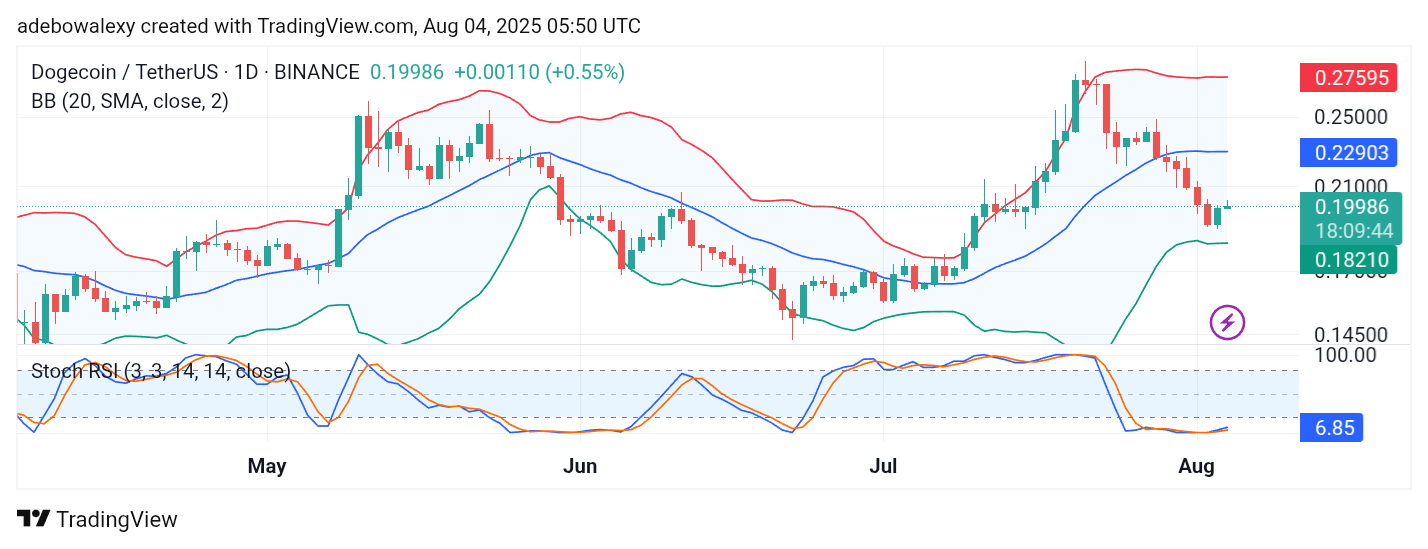
The Dogecoin market appears to have found the base of the recent rebound during the previous session. The current session is following a similar direction, shown by a small, contracted green candle on the chart. As a result, price action remains below the middle band of the Bollinger Bands (BB) indicator.
Meanwhile, the Stochastic Relative Strength Index (SRSI) has been lingering deep in the oversold region but is now beginning to rise slightly due to the recent bounce. This may be an early signal of potential recovery.
DOGE/USDT Retains Vulnerability
Although the Dogecoin market shows early signs of a rebound, it’s clear that price action has not yet exited bearish territory. On the daily chart, DOGE remains under the middle band of the BB indicator, which remains wide and diverged, with its terminal part beginning to move sideways.
The SRSI lines are still positioned in the oversold region but have started moving higher. This suggests a recovery attempt is underway, though stronger buying pressure is still needed to confirm any significant upside.
DOGE/USDT Hits a Brick Wall (4-Hour Chart)
While price action on the daily chart stayed below the BB middle band, the 4-hour chart tells a slightly different story. Here, DOGE briefly touched the middle band in the previous session, triggering a mild bearish rebound in the ongoing session.
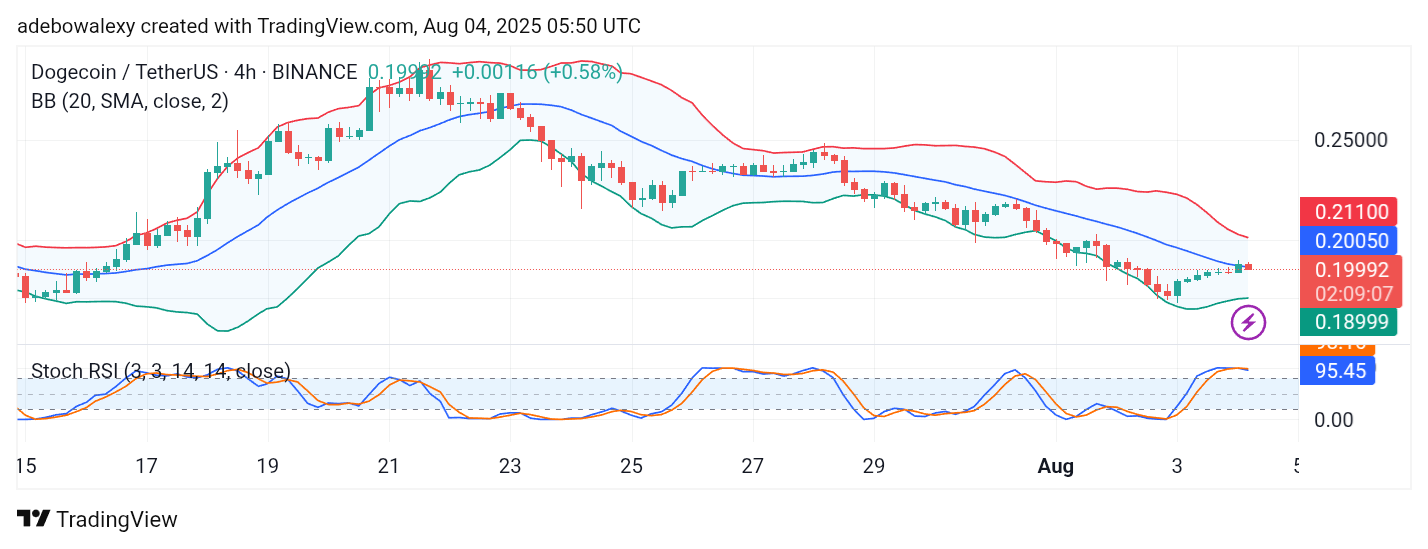
Price action has once again slipped below the middle limit of the BB indicator. Meanwhile, the SRSI lines have entered the overbought zone and are now moving sideways. This signals a potential loss of upward momentum.
That said, bullish traders may still target levels below the $0.2500 mark, though caution is advised as the market shows signs of hesitation.