$SPONGE (SPONGE/USD): Buying the Dip Opportunity
Estimated Reading Time: 2 minutes
Don’t invest unless you’re prepared to lose all the money you invest. This is a high-risk investment and you are unlikely to be protected if something goes wrong. Take 2 minutes to learn more

The $SPONGE market has experienced a sharp decline from around the $0.0007 level, reflecting heightened downside volatility. After reaching the $0.000013 support area, the chart reveals a sequence of four Doji candlesticks following a strong bearish move — a signal that selling momentum may be weakening.
Current market behavior suggests that traders could be accumulating positions at this level, potentially setting the stage for a rebound. If bullish pressure strengthens, a short-term recovery from the $0.000013 support zone may soon unfold.
Key Levels to Watch:
- Resistance: $0.000115, $0.000120, $0.000130
- Support: $0.000010, $0.000009, $0.000008
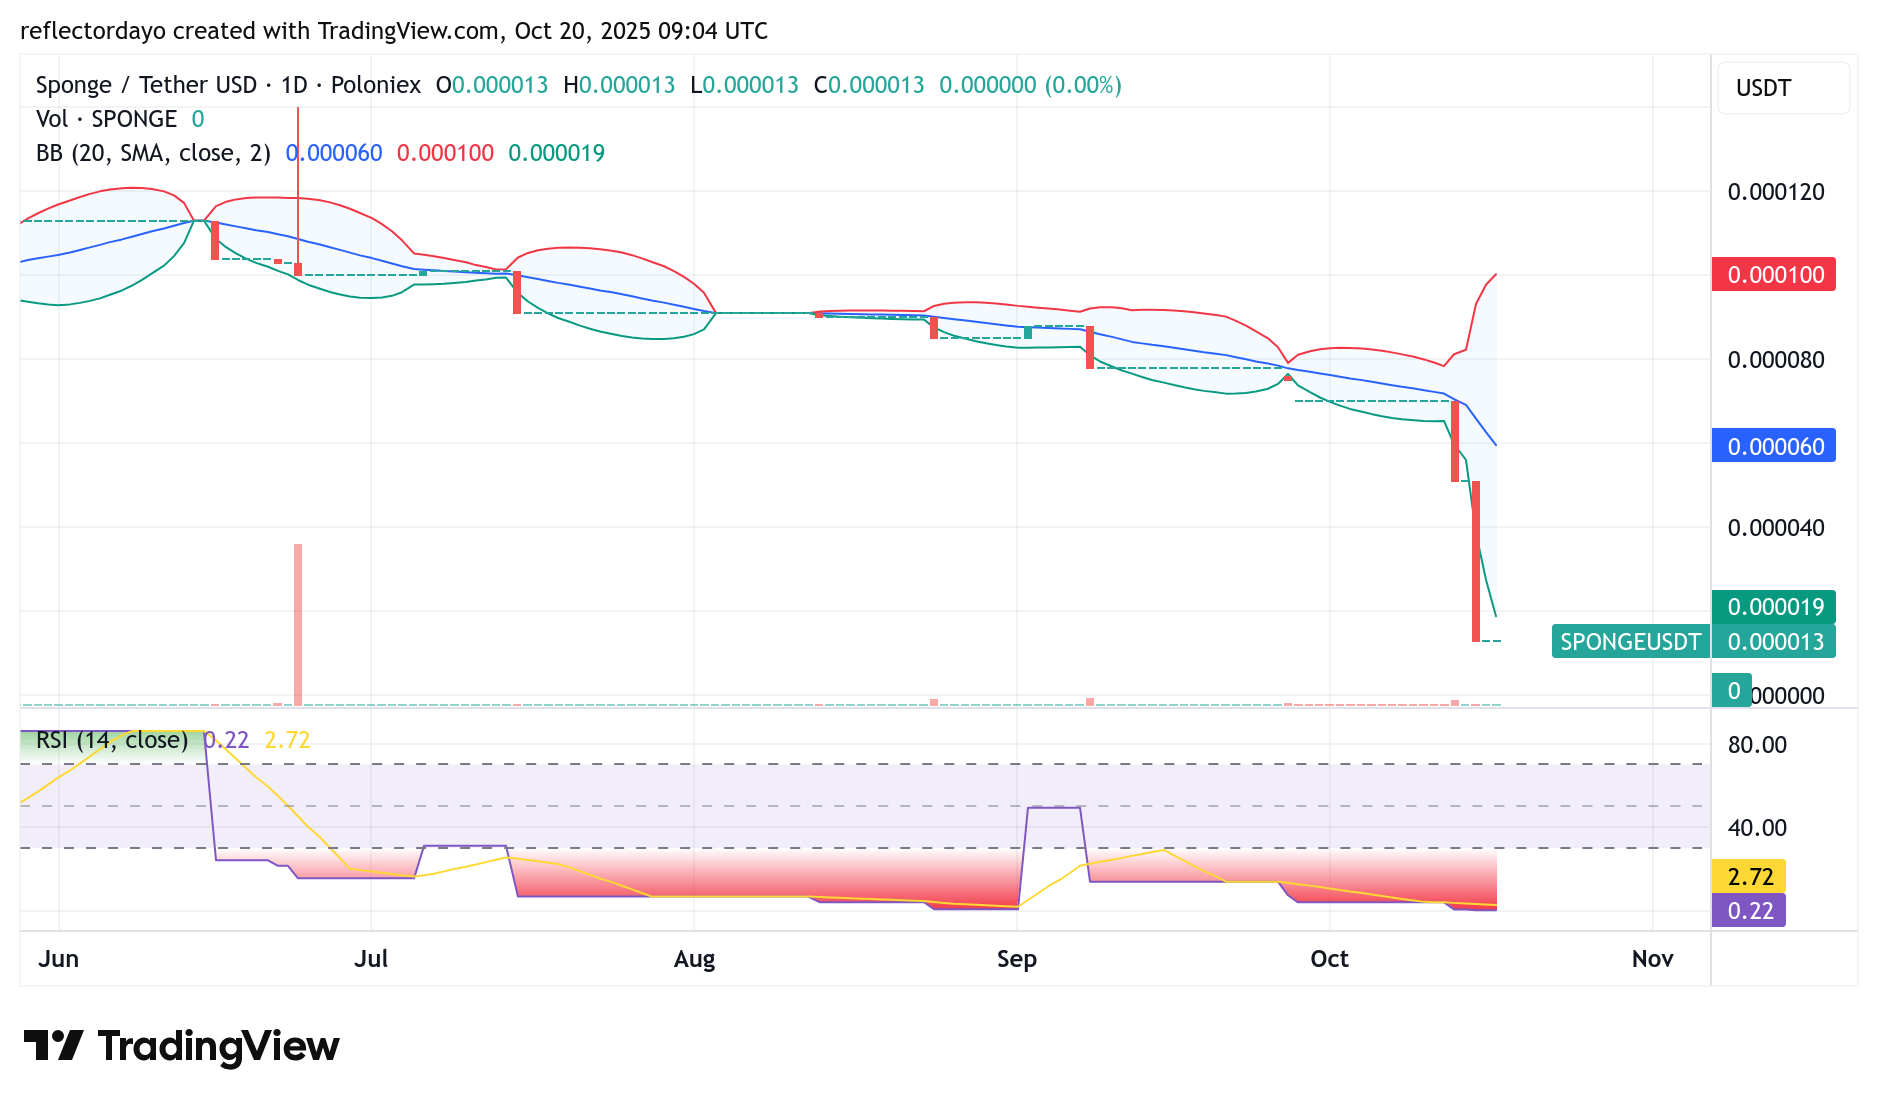
SPONGE/USD Daily Chart: A New Foundation Is Forming
The Bollinger Bands reveal a significant expansion, with a wide bandwidth spanning between the $0.0001 and $0.000019 levels. Notably, the price action has moved below the lower band, indicating that the market is in an oversold condition.
Similarly, the Relative Strength Index (RSI) confirms this strong oversold signal, suggesting that bearish momentum may be reaching exhaustion. At this stage, the $SPONGE market appears primed for a potential rebound, as the current low price levels could begin to attract renewed investor interest.
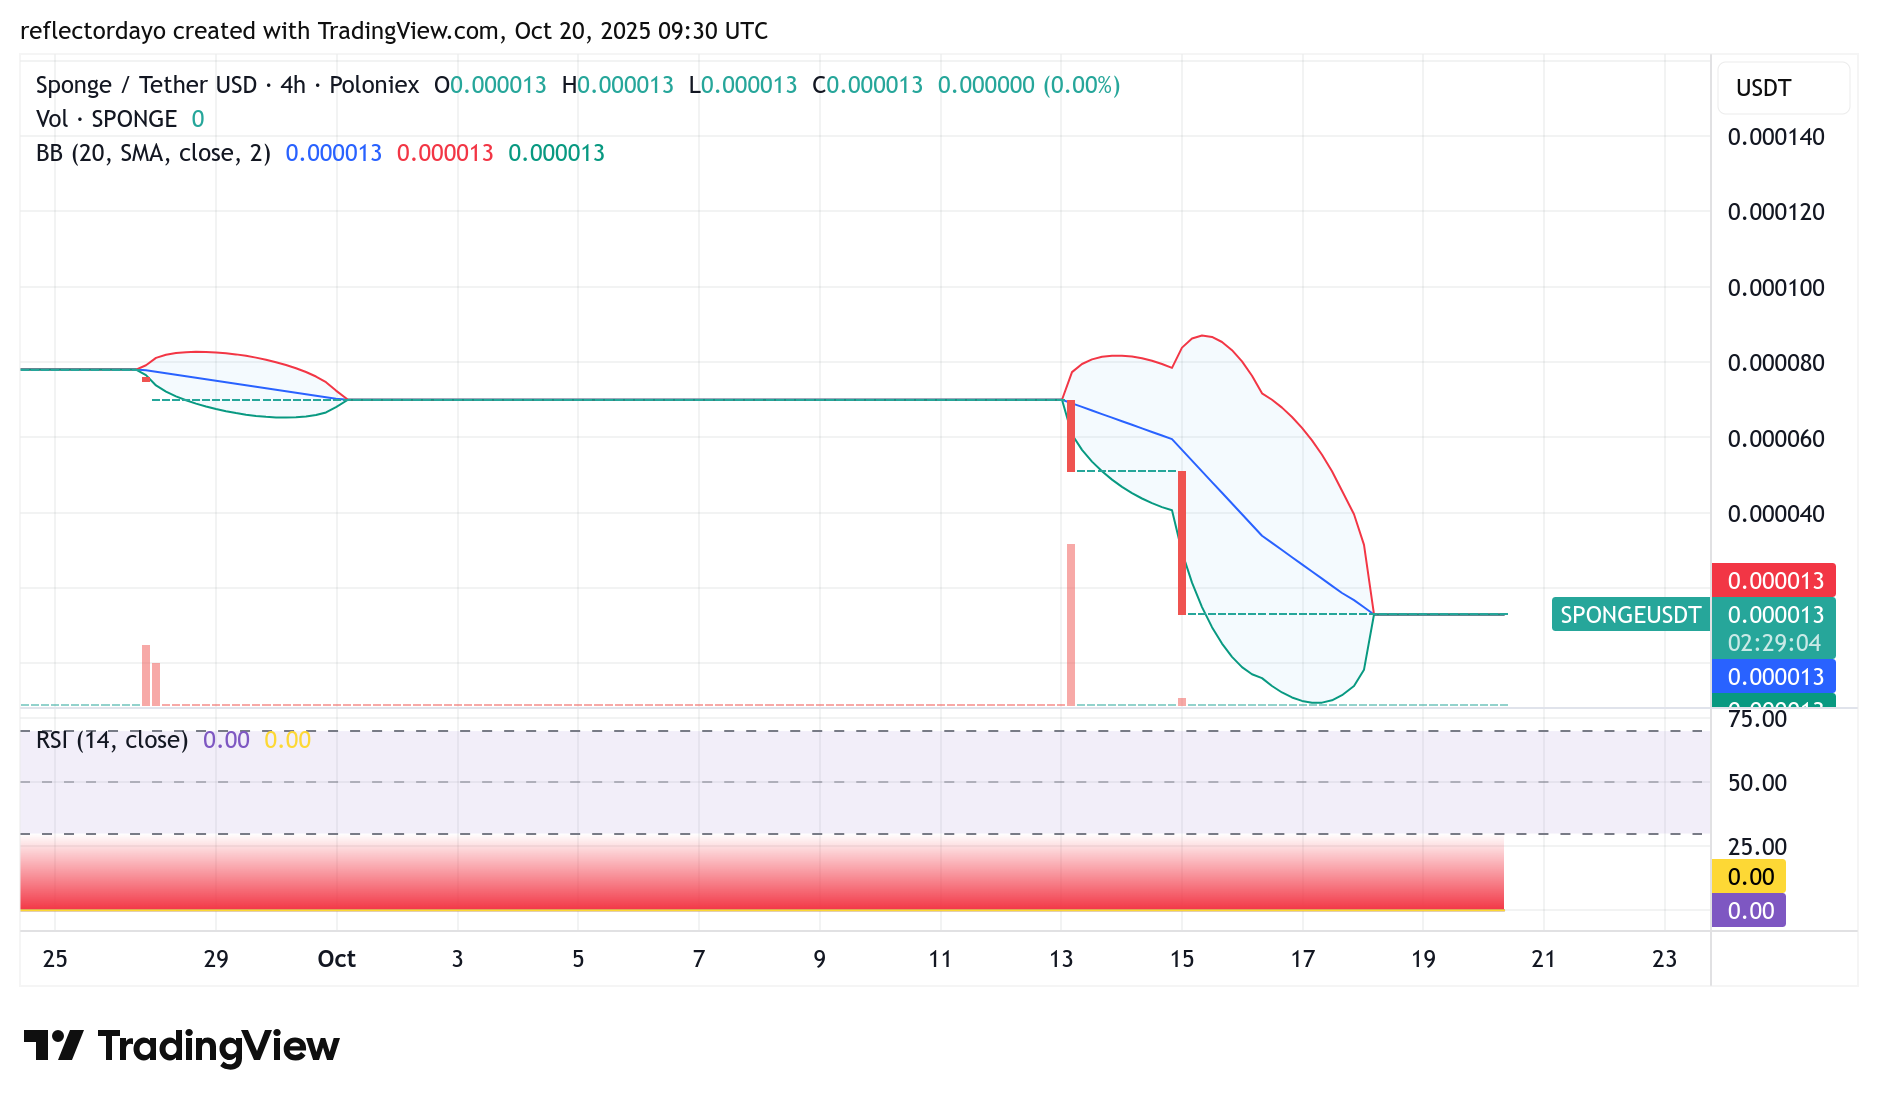
SPONGE/USD 4-Hour Chart Outlook
The market currently holds the potential for a rebound, and if this materializes, the next target for bullish recovery could be around the $0.00006 price level. Given the strength of the preceding bearish move, a sharp upside reaction is possible once buying momentum returns.
The Bollinger Bands indicate heightened volatility, which could further support a strong bullish rebound if market sentiment shifts. Traders may want to monitor this setup closely, as volatility-driven recoveries often present short-term trading opportunities.
Buy SPONGE/USD!
Bears coping hard pic.twitter.com/ITA0Bkj4nj
— $SPONGE (@spongeoneth) October 11, 2025
Join the SPONGE community and get in on the next big crypto opportunity! Buy Sponge ($SPONGE) today