Chainlink (LINK/USDT) Tests Critical Support Level as the Bulls Seek Another Chance
Estimated Reading Time: 3 minutes
Don’t invest unless you’re prepared to lose all the money you invest. This is a high-risk investment and you are unlikely to be protected if something goes wrong. Take 2 minutes to learn more

Chainlink Long-term Analysis: Ranging
The Chainlink against the Tether has shown signs of weakness after a strong rally in the previous year. However, the recent price action reflects that the pair is currently consolidating as the bulls and bears struggle to maintain momentum in the face of uncertainty and declining volume.
To this end, with the Stochastic RSI showing oversold conditions, long-term traders are observing the market for either a bounce or further downside movements.
Currently, Chainlink trades at $12.98, recording a 2.85% gain above the opening price with over 13 million traded volumes for the week.
Technical Indicators
Major Resistance Levels: $13.68, $15.45, and $18.77
Major Support Levels: $12.00, $11.00, and $9.50
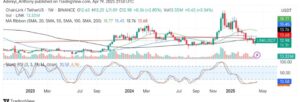
Chainlink Technical Analysis
The analysis for Chainlink against the Tether on a weekly chart shows the pair is currently hovering around the 100 and 200 simple moving averages, showing indecision among traders as the decreasing volume signals a weakened momentum. This suggests the recent bounce to the north may lack strength unless the bullish traders enter the market aggressively.
However, the Stochastic RSI beneath the chart shows that the market in this timeframe is currently oversold, indicating a potential rebound if momentum picks up. To this end, recent price action suggests the pair’s price is compressing with the immediate moving average, forming a potential base. Therefore, if Chainlink can hold above $12.00, a break above $13.68, even $15.00, could materialize. Conversely, a lack of momentum could extend the oversold condition further.
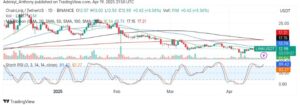
LINK/USDT Analysis: Will the Bulls Regain Momentum or Fade Further?
On the daily chart, LINK/USDT appears to be showing early signs of possible reversal after prolonged southeast movements. The pair’s price has recorded a positive 3.34% gain, suggesting buyers are stepping in. However, the oscillator hints at a possible short-term pullback as the lines operate at the 80-mark level.
On the other hand, the price is operating above the 20-period simple moving average, indicating a renewed bullish interest as the pair aims for the 50-period SMA at $13.74. To this end, if LINK/USDT breaks above $13.74 with a strong volume in the coming session, it could rally towards $17.00, but rejection at this level could lead to a retest of the $12.50 support level.
You can purchase crypto coins here. Buy LBlock