Wall Street Memes (WSM) Trade Steps on, Holding Positively
Estimated Reading Time: 3 minutes
Don’t invest unless you’re prepared to lose all the money you invest. This is a high-risk investment and you are unlikely to be protected if something goes wrong. Take 2 minutes to learn more
Wall Street Memes Price Prediction – April 5
A line of recessive pricing movements has steadily prevailed to create cycles in the market operations of Wall Street Memes coin against the trending capability of the American currency, as the financial situation reports that the crypto-economic trade now steps on, holding positively in its styles of indexes.
The systemic bargaining impulses sustained within the paired instruments have consistently remained tightly constrained below the $0.001 trading line, highlighting the extent to which long-term buyers have positioned themselves in anticipation of regaining momentum ahead of potential, unforeseen rebound movements in the near future.
WSM/USD Market
Key Levels
Resistance levels: $0.0015, $0.002, $0.0025
Support levels: $0.0008, $0.0006, $0.0004
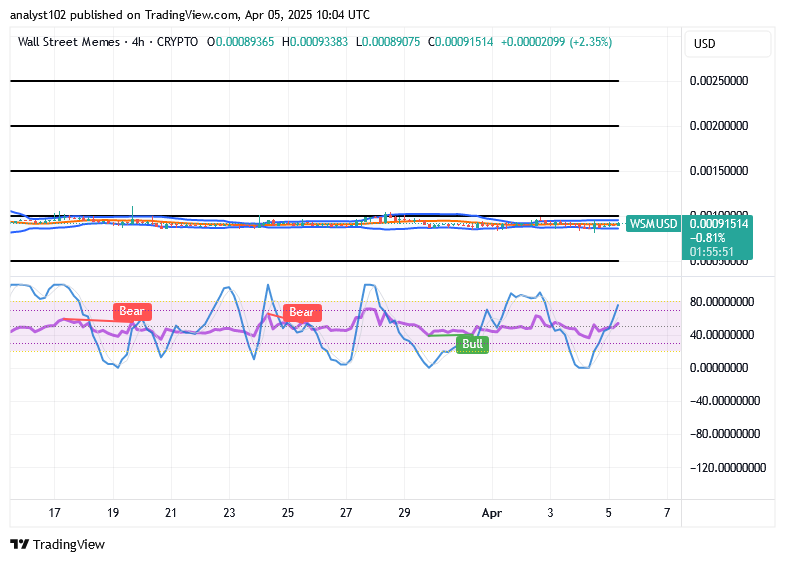
WSM/USD – 4-hour Chart
The WSM/USD medium-term chart pictures that the crypto-economic trade steps on a formidable threshold, holding positively in inputs.
Most of the candlesticks, characterized by varying smaller sizes, exhibit diverse promissory movements capable of evolving into a stronger bullish trend, driving the market back toward an upward trajectory in alignment with the Bollinger Bands formation. The stochastic oscillators have been consistently and systematically fluctuating through various ups and downs, maintaining a bullish signal bias.
Based on the candlestick formation pattern of the WSM/USD market, does the current price action suggest a psychological inclination for buyers to step aside?
The practical pricing actions that have been generating in the market activities of WSM/USD have been such that one is being allowed to let long-term capitalists find a way of joining at a different, lower zone, as the trade condition reveals presently that the price steps on, holding positively.
It would be a good and strategic task for long-position takers to carefully monitor when the oscillators position downward, closely approaching or reaching the oversold region, indicating a safer and more technically sound time to execute buy orders during the accumulation phase.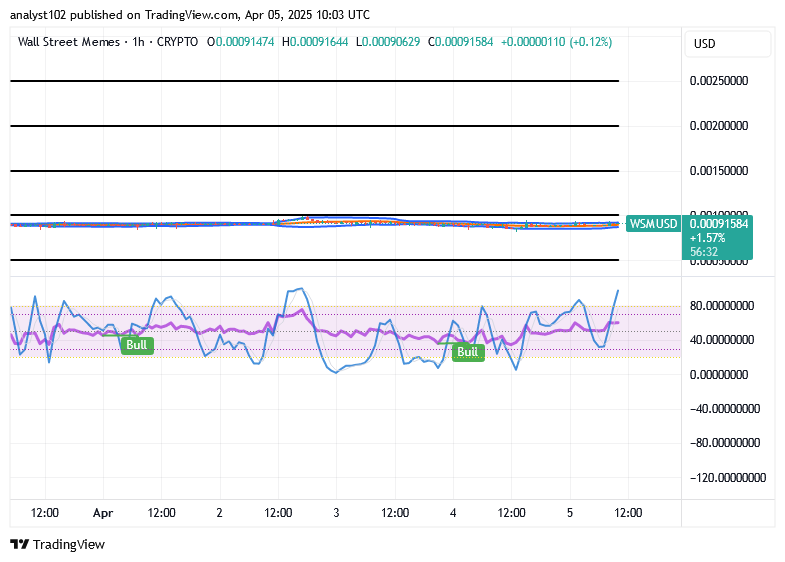
WSM/USD 1-hour chart
The WSM/USD 1-hour chart demonstrates that the short-term pathways of the base crypto-economic price steps on, holding positively in its moves.
Over an extended period spanning several hours into multiple days, the WSM/USD market exhibits the formation of diverse candlestick patterns, indicative of an attempt to establish a foundational support level. This structural development suggests an emerging bullish accumulation phase. Meanwhile, the stochastic oscillators continue to oscillate across multiple directions, albeit with diminished momentum near the lower boundary, signaling a weak but underlying bullish bias.
BIGTIMEUSDT & WSMUSDT trading contracts are now officially live on Bybit!
🚀 BIGTIMEUSDT & WSMUSDT Contracts now on Bybit!
— Bybit (@Bybit_Official) October 12, 2023
Dive into new trading opportunities with 1-25x leverage. Plus, they’re now on Bybit Futures Grid Bot! Start trading now.
📈 BIGTIME: https://t.co/FAQlbhnzAh
📈 WSM: https://t.co/pb2y2AfMBE#CryptoTrading #Bybit