Lucky Block Price Prediction: LBLOCK/USD Will Head to The Upside
Estimated Reading Time: 2 minutes
Don’t invest unless you’re prepared to lose all the money you invest. This is a high-risk investment and you are unlikely to be protected if something goes wrong. Take 2 minutes to learn more

Free Crypto Signals Channel
The Lucky Block price prediction keeps ranging below the moving averages as the coin gets ready to move to the upside.
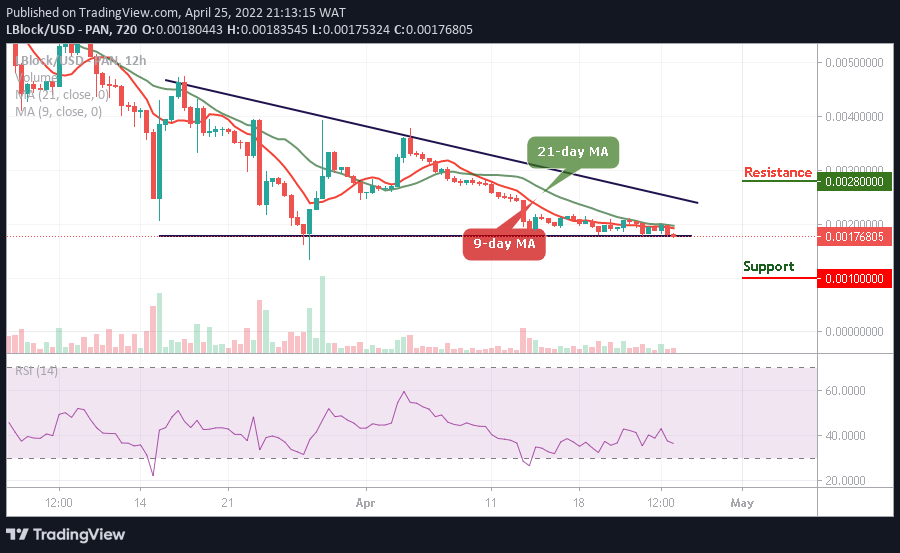
LBLOCK/USD Long-term Trend: Ranging (12H Chart)
Key Levels:
Resistance levels: $0.0028, $0.0030, $0.0032
Support levels: $0.0010 $0.0008, $0.0006
LBLOCK/USD market keeps moving within the channel; preparing the market for the bullish movement. The current market scenario shows that the Lucky Block would soon head to the upside as the technical indicators confirm the trend.
Lucky Block Price Prediction: LBLOCK Focuses on The Upside
The chart above shows that the Lucky Block price hovers around $0.0017 as the coin gets ready for a cross above the moving averages that could push the price above $0.0020. Any further bullish movement could hit the resistance levels of $0.0028, $0.0030, and $0.32.
More so, the Lucky Block price may fall slightly below the lower boundary of the channel to touch the supports at $0.0010, $0.0008, and $0.0006, but once this occurs, new buyers are to come into the market while the existing buyers are to buy the dip.
LBLOCK/USD Medium-term Trend: Bearish (4H Chart)
The Lucky Block is seen below the 9-day and 21-day moving averages, creating more downs as the new buyers are to buy the dips. However, it is now time for more buyers to come into the market as the coin prepares to hit the resistance level of $0.0020 and above.
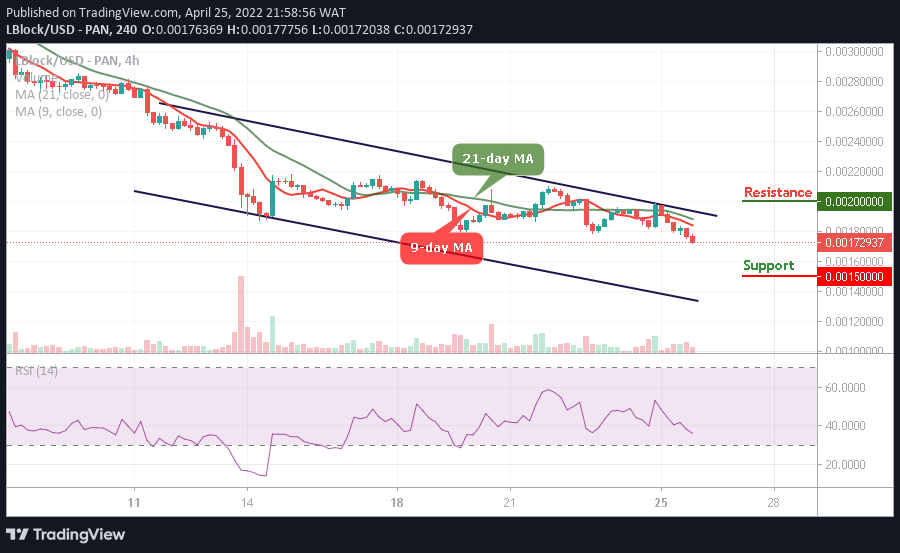
Moreover, LBLOCK/USD may slide towards the lower boundary of the channel to locate the support at $0.0015 and below. However, the Lucky Block price may drop more to give more investors a chance to re-invest and accrue more gains as the technical indicator Relative Strength Index (14) moves below the 40-level.
Read more: