ChainLink (LINK/USDT) Encounters Critical Support Test Amid Growing Market Volatility
Estimated Reading Time: 3 minutes
Don’t invest unless you’re prepared to lose all the money you invest. This is a high-risk investment and you are unlikely to be protected if something goes wrong. Take 2 minutes to learn more

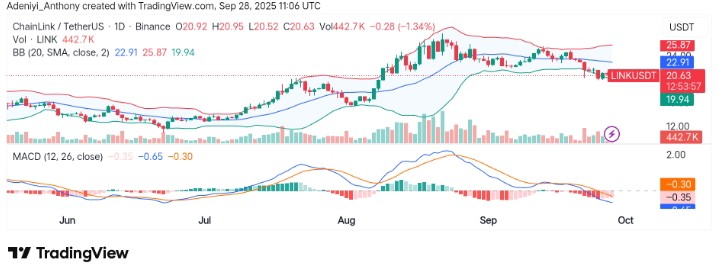
In recent weeks, the price of Chainlink against Tether has faced a notable decline, dipping below critical support. Every candlestick formed moved close to the lower segment of the Bollinger after failing to break above $25.80.
At the moment, the pair appears to be maintaining a position above $20.00, testing immediate support as the price consolidates, waiting for a breakout or further breakdown. Notably, the Moving Average Convergence Divergence (MACD) indicator seems to be showing signs of growing bearish momentum as the lines extend downward.
Currently, Chainlink trades at $20.63, with the volume indicator recording fewer than 500 thousand trades for the day.
Technical Indicators
Major Resistance Levels: $22.91, $24.00, and $25.87
Major Support Levels: $20.00, $19.00, and $18.00
Chainlink Technical Analysis
On the daily chart, Chainlink against Tether technically faces significant selling pressure, with the MACD signaling a bearish divergence. Now, the price appears to be testing the lower Bollinger Band, a critical level that could dictate the next direction of the price in the near future.
As it stands, the momentum oscillator is in favor of the bears, but the formation of a bullish engulfing candle or MACD crossover to the upside would change the current status.
In the last 24h, Chainlink has seen a decrease of around 1.98% after the bearish MACD crossover failed the retest at $21.13. Above all, Link profit-taking appears to be extending more than 90 days, triggering sell pressure.
To this end, if the pair can maintain a hold above the current position, a reversal attempt would be initiated. However, a break below $19.94 would signal another sell round.
LINK/USDT Ready for an Upside Move?
Chainlink, like Bitcoin, has had a significant top. However, just like any other altcoin, the coin has been trending downward, and it looks like $24 is the closest resistance structure. As it stands, the price must hit above this level and other upper limits if momentum is sustained. Meanwhile, Chainlink may have to extend to the south a bit before any upside move.
LINK/USDT Analysis: Facing Bearish Tides
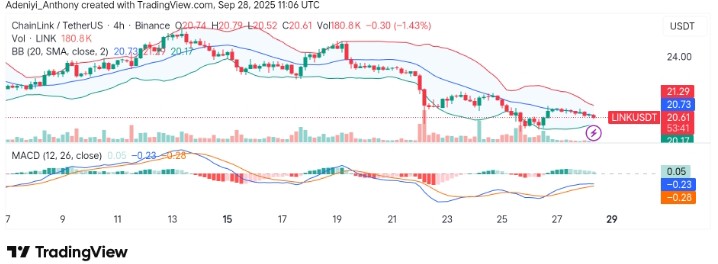
On the 4H chart, LINK/USDT seems to be facing growing bearish momentum with the price operating below the dynamic band level. The histogram of the MACD appears to be signaling further downside potential with lines operating below the signal line.
As it stands, if the pair fails to record gains above the $20.73 dynamic level, a deeper decline below the next support level at $19.94 may surface.
You can purchase crypto coins here. Buy Crypto