Chainlink (LINK/USDT) Navigating the Current Consolidation Zone as Breakout Levels Lie Ahead
Estimated Reading Time: 3 minutes
Don’t invest unless you’re prepared to lose all the money you invest. This is a high-risk investment and you are unlikely to be protected if something goes wrong. Take 2 minutes to learn more

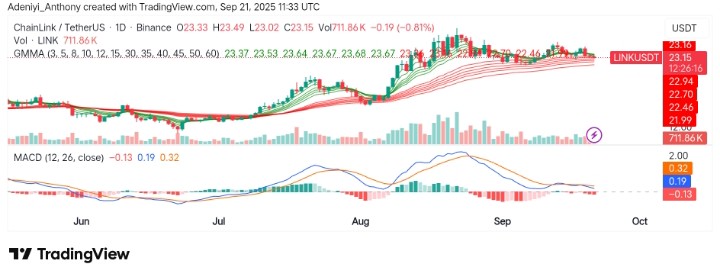
The recent price action of Chainlink against Tether shows a consolidation phase, where the price has been fluctuating between key lower limit and upper boundary. After a strong bullish rally before the month of September, and as it stands, the market has shifted to a more neutral to slightly bearish sentiment.
Right now, the Moving Average Convergence Divergence (MACD) is also showing decreasing bullish momentum, as the short-term moving average is approaching the longer-term moving average. To this end, this suggests that the bullish trend might be losing steam, and a potential reversal or more range-bound activity could be in play. Currently, ChainLink trades at $23.15 with more than 711 thousand traded volumes for the day.
Technical Indicators
Major Resistance Levels: $23.90, $24.10, and $25.00
Major Support Levels: $22.46, $22.00, and $21.00
Chainlink Technical Analysis
Currently, the price of ChainLink against Tether is in a neutral zone, but the market is closely watching the $22.46 to $23.67 range. The Guppy Multiple Moving Average (GMMA) and the MACD appear to be displaying a near bearish scenario.
However, unless a large volume of bullish participation is recorded, the anticipated move above $23.90 may not materialize. Also, the pair risks more downside if the current support at $22.46 fails to hold.
Chainlink’s Skyrocketing Move in View?
Chainlink has continued to move sideways with resistance between $25 and $27. However, many altcoins seem to be exhibiting the same moves, but the token’s move appears more spectacular. Without a formation of higher highs and lows or lower highs and lows, the market for ChainLink remains directionless.
LINK/USDT Analysis: Struggling with Resistance Levels
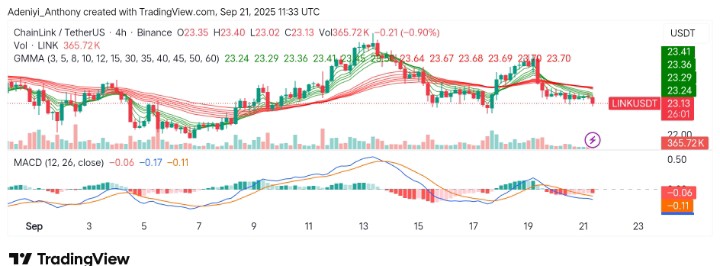
The market for LINK/USDT on the 4-hour chart shows a recent price struggle just below the $23.70 resistance level, indicating drop in bullish momentum. As it stands, the price is currently drifting lower, with the MACD showing a bearish divergence. This aligns with the overall price pattern, as the price appears to be trapped in a consolidation zone between key resistance at $23.70 and support around $23.00.
Looking ahead, the volume in this timeframe appears to have decreased significantly in the last few trading sessions. This indicates a lack of strong buying interest to push the price higher. No matter what, the price must cross the $23.90 line for a confirmed long position; a break below $22.46 would suggest further decline.
You can purchase crypto coins here. Buy Crypto