ChainLink (LINK/USDT) Faces Strong Resistance at $25.00 Despite Bullish Structure
Estimated Reading Time: 3 minutes
Don’t invest unless you’re prepared to lose all the money you invest. This is a high-risk investment and you are unlikely to be protected if something goes wrong. Take 2 minutes to learn more

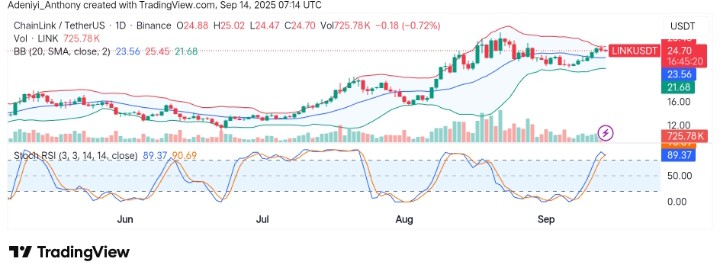
ChainLink against Tether from the daily chart presents a bullish outlook, as seen from its recent surge. However, there are a few signs that could indicate the pair may face a minor roadblock in the near term. As it stands, this suggests that while there is a strong uptrend, caution is warranted as the price may face pullbacks before resuming its ascent.
Currently, ChainLink trades at $24.70 with over 725 thousand traded volumes at the beginning of the day.
Technical Indicators
Major Resistance Levels: $25.07, $28.00, and $31.00
Major Support Levels: $22.60, $21.58, and $20.00
ChainLink Technical Analysis
Technically, ChainLink against Tether looks promising as the direction tends towards the north. However, previous candles explained that the bulls are finding it difficult to maintain a position above $25.00, where the upper limit is located.
Also, the Stochastic RSI displays an overbought condition with a bent blue line, suggesting the bullish momentum may be waning as the price aims for the immediate support.
To this end, the price is currently in a strong uptrend, but it is showing signs of overbought conditions. A pullback towards key support zones, particularly near $21.68, could offer a buying opportunity for those looking to enter during a retracement.
Is ChainLink Ready for an Upside?
ChainLink on a bigger timeframe is showing some upside momentum recently. However, it appears compressed under a long-term trend line. Also, a lot of coins in the crypto market are trying to break above similar barriers, but LINK seems to be targeting $28 for a move towards $47. As it stands, ChainLink against Tether on the weekly timeframe seems to be doing fine above support levels. However, a more cautious approach is needed on the daily timeframe.
LINK/USDT Analysis: Building a Solid Base for a Continued Upside
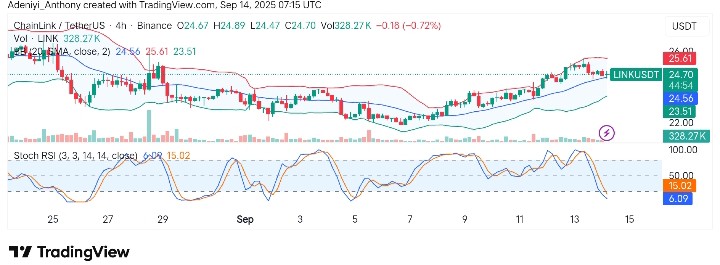
On the 4-hour chart, LINK/USDT shows a continuation of the bullish trend with the price hanging slightly above the dynamic midline of the Bollinger Bands. However, the Stochastic RSI is currently in an oversold zone, suggesting that the market may be on a short-term pullback. As it stands, this could trigger upward movement once the Stochastic RSI crosses back into a bullish zone.
From another angle, a bounce from support combined with a positive Stochastic RSI crossover could offer confirmation for more upside. At the moment, $25.61 is the key resistance on the chart, and a move above this level could be the continuation of the existing trend. However, a slight correction towards $23.51 could offer a foundation for a bullish continuation towards higher resistance levels.
To this end, the market remains bullish as long as the price stays above $23.51; a break below this line may trigger deeper retracement.
You can purchase crypto coins here. Buy Crypto


