ChainLink (LINK/USDT) Consolidates Near $22.03 Support: What’s Next?
Estimated Reading Time: 3 minutes
Don’t invest unless you’re prepared to lose all the money you invest. This is a high-risk investment and you are unlikely to be protected if something goes wrong. Take 2 minutes to learn more

Chainlink against Tether has recently shown signs of indecision. However, it appears that the LINK has shown solid growth in previous months, but recent actions reflect potential consolidation with a slight downward bias in the short term.
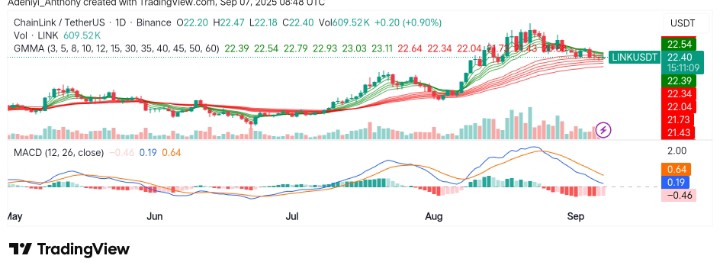
Chainlink has recently faced a series of indecisive candlesticks, with long upper wicks and doji formations indicating the desire of the bulls and bears to dominate. While there has been a recovery from recent lows around the $22.03 support, the price is now testing the key resistance zone at $22.63. However, the tight price ranges provided by Guppy Multiple Moving Averages (GMMA) suggest that market participants are waiting for a decisive breakout.
Currently, ChainLink trades at $22.40 with over 609 thousand daily volume.
Technical Indicators
Major Resistance Levels: $22.67, $23.09, and $23.51
Major Support Levels: $22.03, $21.72, and $21.00
ChainLink Technical Analysis
On the daily timeframe, ChainLink against Tether appears to be correcting towards a lower support line after a brief rally. The GMMA seems to be squeezing as both sets of EMAs converge together. Though this may look like a reduction in value. However, upon careful inspection, the bulls may be preparing for a breakout in the coming session, provided the volume is sustained.
Beneath the chart, the MACD has been fluctuating around the zero line, indicating no clear momentum at the moment. However, the histogram’s recent red bars suggest a loss of upward momentum, but an increase from the bull side would further push the bullish intent.
To this end, a breakout awaits the bulls around $22.67, but further movement below $22.03 might indicate a correction on the shorter timeframe.
Is ChainLink Ready for an Upside Move?
On the larger timeframe, it does look like ChainLink is on a corrective pullback towards $19.00. However, on the smaller session, the market bleeds, trending to the south. To this end, what is happening now is not large enough to be called a bearish move but a corrective pullback for a bigger upside movement.
LINK/USDT Short-term Analysis: Expectations
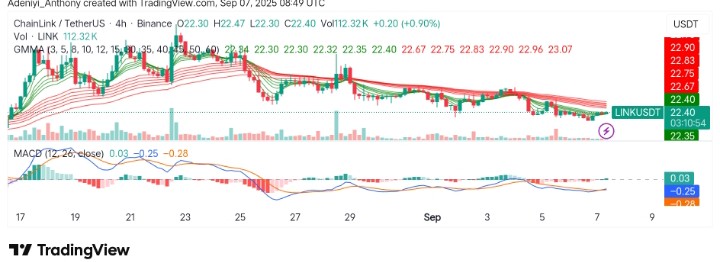
The 4-hour chart of LINK/USDT suggests a growing but mild bearish momentum. After a failed attempt to break higher, the price has been testing critical support levels around $22.35. As it stands, the GMMA bands have continued to widen, with the longer-term averages trending downward. This is signaling sustained downward pressure.
On the other hand, the MACD is showing a bearish crossover with the histogram in negative territory, reinforcing the lack of bearish reign. However, the curvature of the MACD hints at a reversal, as recent expansion of reserve, activities of the whales, and institutional adoption may drive the price soon.
To this end, LINK/USDT needs to hold above $22.35 support for an upside move, but if the formation of lower lows continues, the pair might decline further before another chance to rally to the north.
You can purchase crypto coins here. Buy Crypto