Quant Price Prediction: QNT/USD Prepares for a Strong Movement Above $120
Estimated Reading Time: 3 minutes
Don’t invest unless you’re prepared to lose all the money you invest. This is a high-risk investment and you are unlikely to be protected if something goes wrong. Take 2 minutes to learn more
Quant Price Prediction – December 10
The Quant price prediction will recover to the upside as the coin gets ready for a cross above the 9-day and 21-day moving averages.
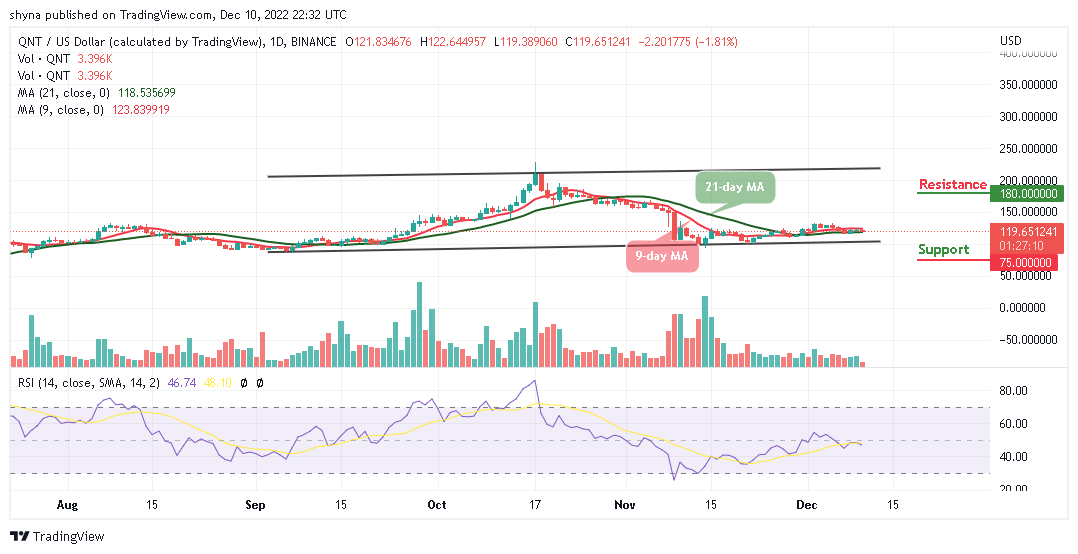
QNT/USD Medium-term Trend: Ranging (1D Chart)
Key Levels:
Resistance levels: $180, $200, $220
Support levels: $75, $55, $35
QNT/USD is ranging as the coin gets ready to cross above the 9-day and the 21-day moving averages. Meanwhile, the market will become lower for new and existing buyers to enter the market. Conversely, should the bulls fail to push the price upward, the Quant price may continue with the sideways movement before heading to the upside.
Quant Price Prediction: QNT/USD Would Move Higher
The Quant price will break towards the upper boundary of the channel as soon as the bulls make the coin to reclaim the $122 resistance. However, any further bullish movement toward the upper boundary of the channel will hit the potential resistance levels of $180, $200, and $220.
On the other hand, the upward movement may be delayed if the coin slides below the lower boundary of the channel which could touch the low of $75, $55, and $35 support levels. More so, the technical indicator Relative Strength Index (14) remains above the 40-level to prepare for the upward movement.
QNT/USD Medium-term Trend: Ranging (4H Chart)
Looking at the 4-hour chart, the Quant moves to cross above the 9-day and 21-day moving averages and the bulls need to hijack the market from the bears and head towards the north to touch the major resistance level at $125. If the buyers push the price towards the upper boundary of the channel, higher resistance could be located at $130 and above.
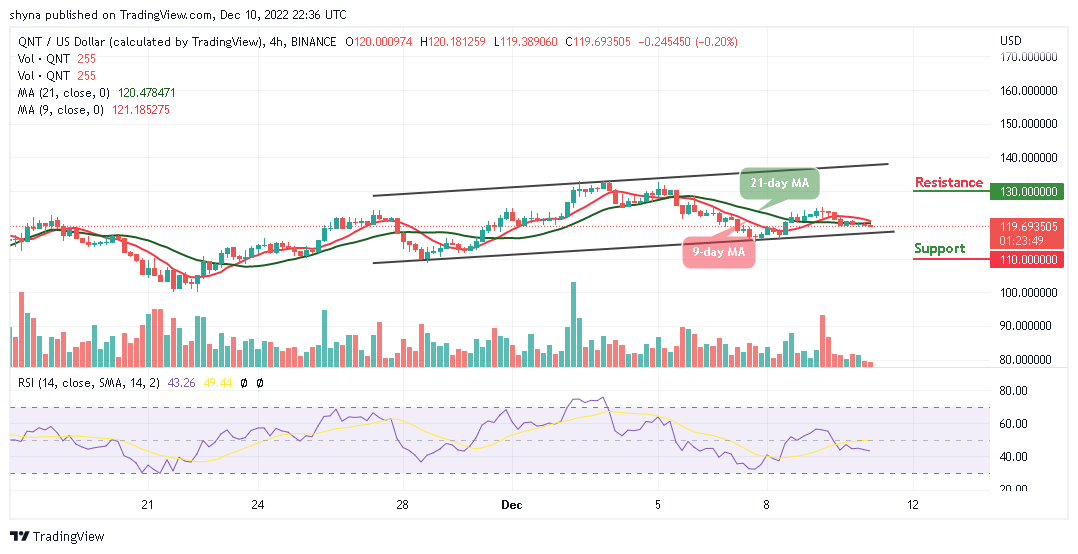
Moreover, the technical indicator Relative Strength Index (14) moves below the 60-level, encouraging new and existing buyers to invest in the coin. Therefore, should the bulls fail to move the current market value above, the bears could revisit the market, and the nearest support level could be found at $110 and below.
Place winning Quant trades with us. Get QNT here