SpongeBob (SPONGE/USD) Prepares a Strong Base at $0.00100
Estimated Reading Time: 2 minutes
Don’t invest unless you’re prepared to lose all the money you invest. This is a high-risk investment and you are unlikely to be protected if something goes wrong. Take 2 minutes to learn more

Securing a firm base at the $0.00100 price level will set the bull market on a course of more conquest in the supply zone. In the SpongeBob market between the closing of yesterday’s trading session and early today’s market, we see a serious battle between bulls and bears around the $0.00100 price level. The bulls secure the $0.0007543 price level in proximity to the main target as the struggle continues.
Key Levels
- Resistance: $0.0020, $0.00230, and $0.0025
- Support: $0.000745, $0.0006, and $0.0005.
Sponge (SPONGE/USD) Price Analysis: The Indicators’ Point of View
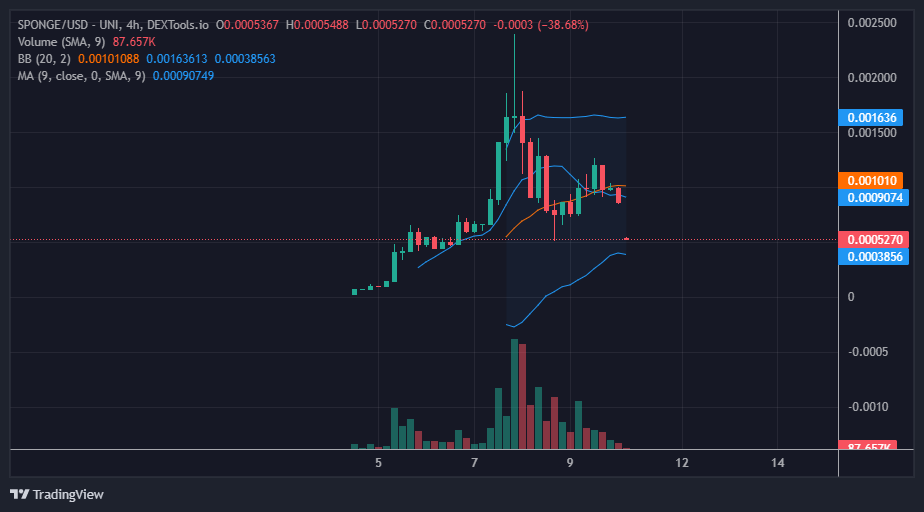
The Bollinger Bands indicator reflects high volatility because the two standard deviations are very divergent from the 20-day moving average and themselves. This is a good sign because it points to constant activity in the market. However, for the time being, the $SPONGE price is moving around the equilibrium price level. This makes it a bit tricky to point out who might be winning between the bulls and the bears. Moreover, as the day’s trading session nears its end, the volume of trade also drops. Hopefully, by the next trading session, the bulls will take over the market with full force. This is because traders are still bullish around the $0.0007543 support level.
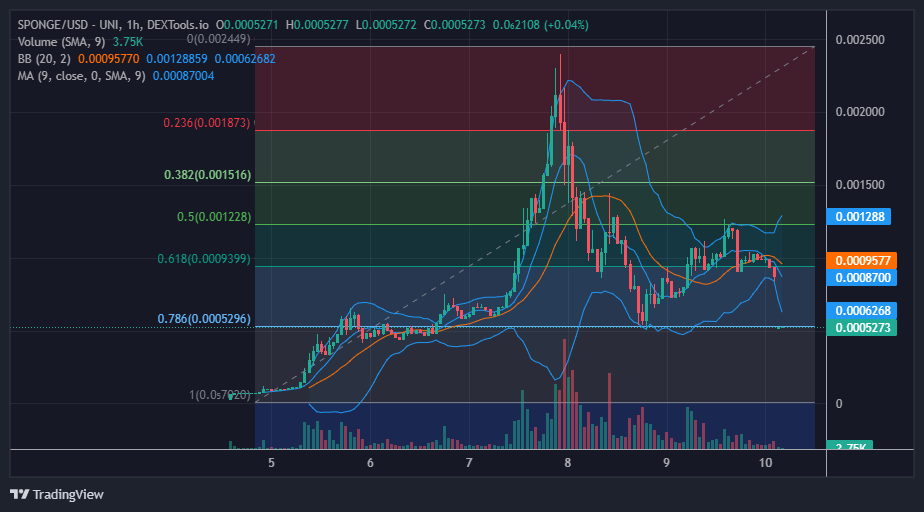
SPONGE/USD Short-Term Outlook: 1-Hour Chart
Looking at the information provided by the Fibonacci retracement tool, we notice a sharp decline in the market in the latest 1-hour session. The price fell to 78.6%, which is the $0.0005296 price level. This information may contribute to the bullish sentiment, as most traders will expect the bull market to take off from here. The Bollinger Bands indicator, from this point of view, still points to high volatility. This increases the possibility of a bullish move in the next daily trading session.
SpongeBob is live on MEXC.
Happy to announce that the @spongeoneth Kickstarter has concluded and $SPONGE will list on MEXC!
🔹Deposit: Opened
🔹SPONGE/USDT Trading in the Innovation Zone: May 11, 10:00 (UTC)Details: https://t.co/mFZBC5ZYme#SpongeBob #MEXC pic.twitter.com/5guRXTnVCZ
— MEXC (@MEXC_Official) May 10, 2023
Invest in the hottest and best meme coin. Buy SpongeBob ($SPONGE) today!