Chainlink (LINK/USDT) Eyes Recovery as the Bulls Seek to Reclaim $13.00
Estimated Reading Time: 3 minutes
Don’t invest unless you’re prepared to lose all the money you invest. This is a high-risk investment and you are unlikely to be protected if something goes wrong. Take 2 minutes to learn more

Chainlink Long-term Analysis: Bullish
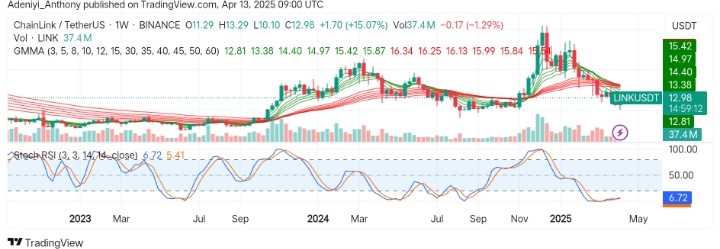
The market for Chainlink against the Tether after the previous downtrend has received a slight surge to the top, pushing the pair’s low from $10.10 to above the $12.00 level. This uptick follows a multiple-week downtrend, which coincides with the trade volume and the Stochastic RSI. However, the volume gradually increases, suggesting an early accumulation as Chainlink bullish traders attempt to regain momentum.
As it stands, the pair is testing the cluster of Guppy Multiple Moving Averages (GMMAs), preparing for a reversal to the north.
Currently, Chainlink trades at $12.98, recording 34.5 million traded volumes and 15.07% gains.
Technical Indicators
Major Resistance Levels: $13.38, $14.40, and $15.87
Major Support Levels: $12.81, $11.29, and $10.10
Chainlink Technical Analysis
On the weekly timeframe, the analysis of Chainlink against the Tether shows a reversion strategy as the Stochastic RSI and the volume suggests accumulation as the bounce from the $10.10 shows that buyers are stepping in.
From another angle, the GMMAs suggest the price may try to break upward through compressed resistance levels. However, caution is needed until a clear trade above $14.00 is achieved for a reversal.
To this end, waiting for a bullish crossover with the blue line crossing the 20-mark level would confirm a trend reversal.
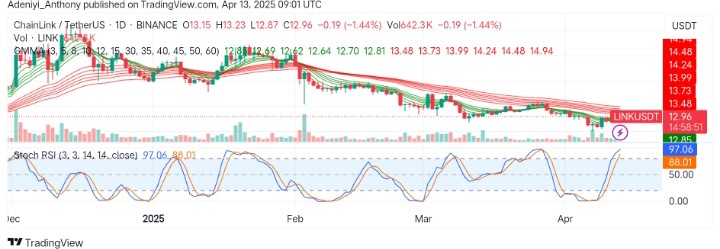
LINK/USDT Analysis: Recovery or Continued Downtrend?
On the daily chart, LINK/USDT is in a sustained downtrend, consistently trading below the GMMA as the pair sees a slight drop in price despite what is happening in the bigger timeframe. The long-period EMAs seem to be widely spread, suggesting increasing bearish momentum.
However, the volume is relatively low, and the Stochastic oscillator operates in the overbought region, suggesting the sellers are in control and the pair might see a short-term pullback before the potential recovery.
To this end, the price needs to break above $14.10 for a shift in the short-term bearish structure. Conversely, a further break below would signal a continued downtrend.
You can purchase crypto coins here. Buy LBlock